EducationSoftwareStrategy.com
StrategyCommunity

Knowledge Base

Product

Community

Knowledge Base

TopicsBrowse ArticlesDeveloper Zone

Product

Download SoftwareProduct DocumentationSecurity Hub

Education

Tutorial VideosSolution GalleryEducation courses

Community

GuidelinesGrandmastersEvents
x_social-icon_white.svglinkedin_social-icon_white.svg
Strategy logoCommunity

© Strategy Inc. All Rights Reserved.

LegalTerms of UsePrivacy Policy
  1. Home
  2. Topics

Bar Chart Race Visualization for Time Lapse


Dong-Hyub Lee

Principal Sales Engineer • MicroStrategy


D3 Custom Chart for Time Lapse Animation

This visualization requires 1 attribute for name category, 1 attribute for trend series, and 1 metric value for ranking. 
For time series, you have to set the sort order of trend attribute ascending in the widget to play time chronically. 

ka04W000001IuHRQA0_0EM2R000000oKFM.jpeg

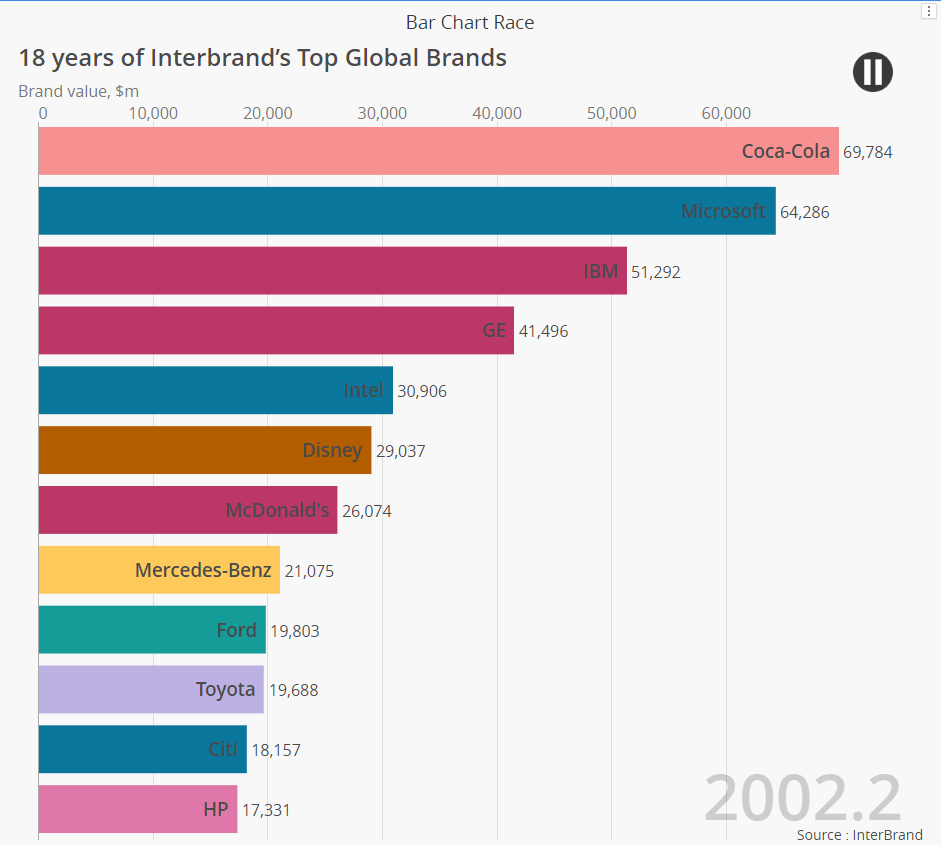
It automatically plays a time lapse. You can set it disable in the configuration tab. From there, you can also set font style and play speed. 
Enjoy! 
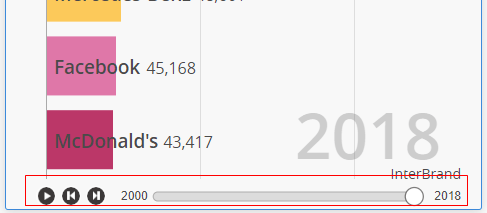
Added  control button below   

ka04W000001IuHRQA0_0EM2R000000fLBe.jpeg

 
Fixed issue of new bar is not smoothly appeared. 
Added Feature 10/08 
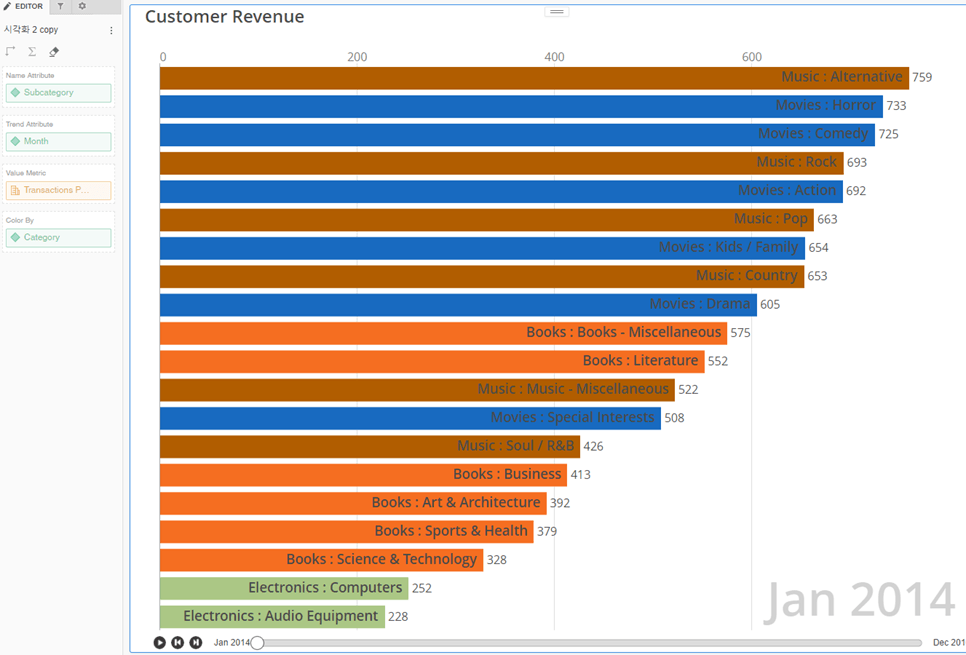
You can add other attribute for display group color for the barchart.  See the below example. 

ka04W000001IuHRQA0_0EM4W000001J2Jd.jpeg

Fixed issues 3/26 
Fixed bug in IE11 . 

Installation Instructions

  • To install this visualization, download the .zip file below and deploy it in Strategy Desktop or Strategy Web. 
  • After you have installed the visualization, you can open a working demo of this visualization by downloading the .mstr file below and doing the following:
    • To open the demo visualization in Strategy Desktop, double click the .mstr file.
    • To open the demo visualization in Strategy Web, choose Create -> Upload Strategy File -> View Dashboard ​​​​​​​
  • Source code is attached as D3BarChartRace_Source.zip. It contains only javascript and less files. If you want to compile it , please refer visualization SDK tool install help , https://www2.Strategy.com/producthelp/Current/VisSDK/Content/topics/HTML5/intro_custom_viz_tool.htm  

Watch a quick tutorial video on importing custom visualizations in Workstation.
Strategy Version 
* Tested under version 2020
Strategy feature 
* PDF Export 
 
Publisher: DongHyub Lee (Sales Engineer in  Strategy Korea)  
Visualization Disclaimer
 
By downloading or using this visualization, you accept and acknowledge these terms.
This visualization is both intended as sample code and provided as a convenience to Strategy users. Strategy cannot guarantee that the code provided will apply to any Strategy releases and clients outside of the versions stated within this article. This sample is supported by Strategy Technical Support up to and including the basic visualization functionality listed in this article. Defects will be triaged by the Strategy team as they are raised. For users with active Strategy Technical Support contracts, contact Strategy Technical Support to raise these defects.


Comment

0 comments

Details

Example

Published:

March 24, 2020

Last Updated:

February 21, 2022