Starting with the release of Strategy ONE (March 2024), dossiers are also known as dashboards.
1. Basic Features
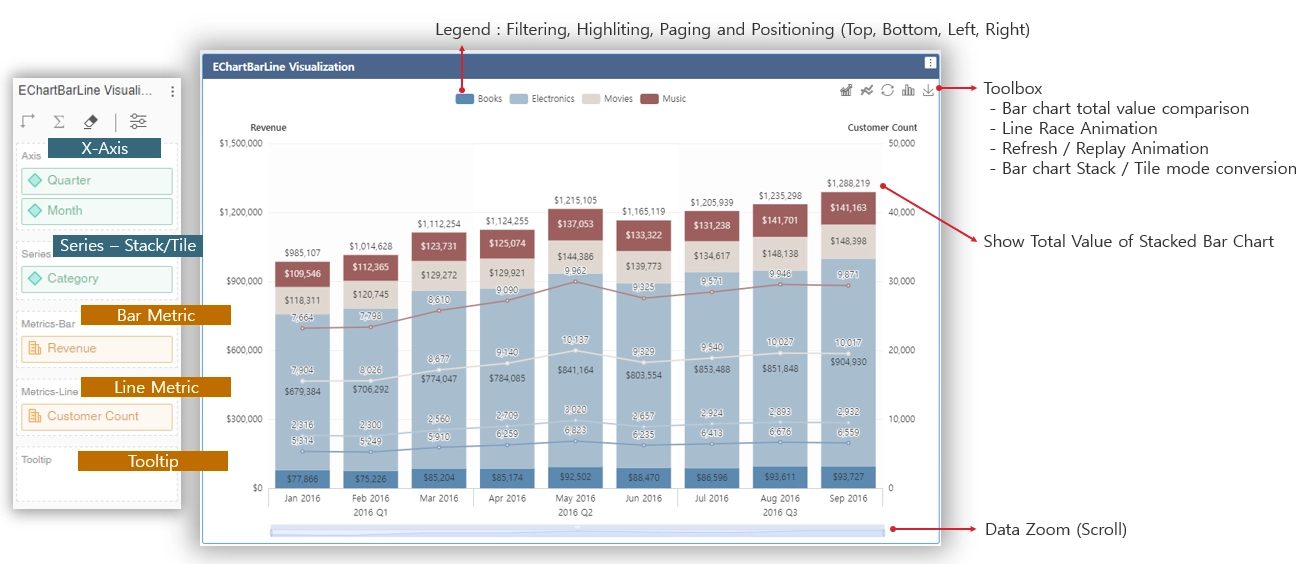
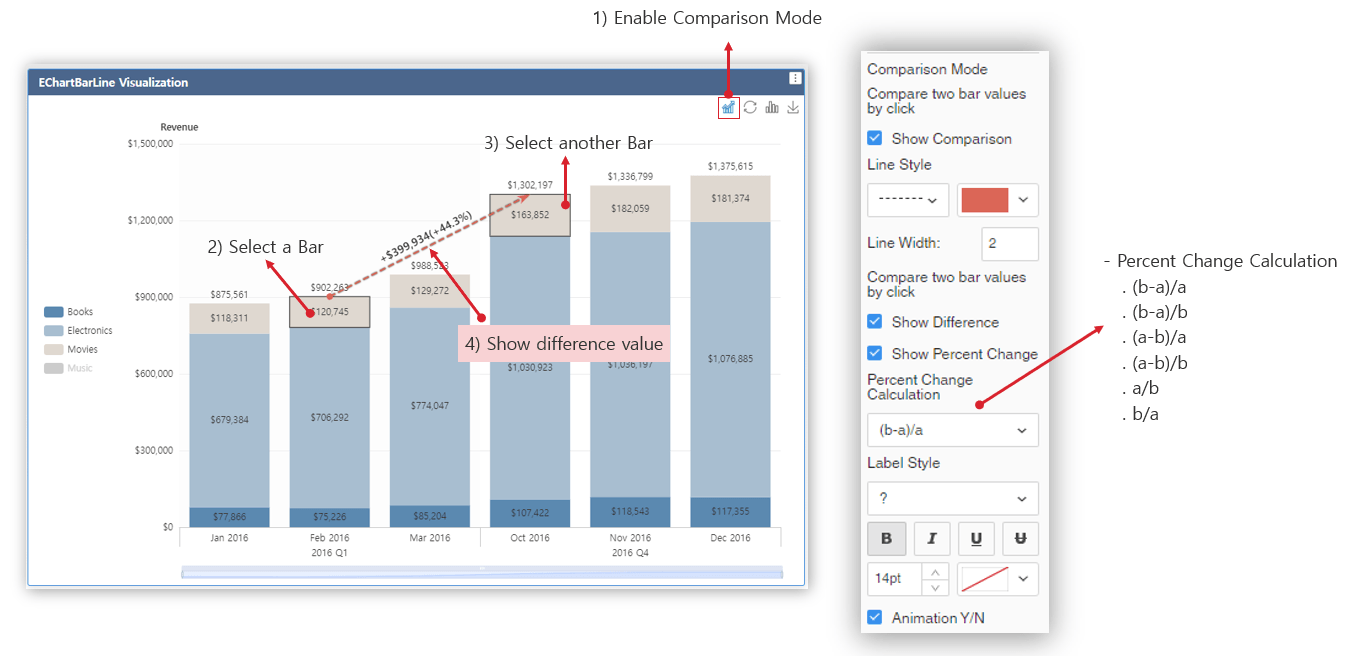
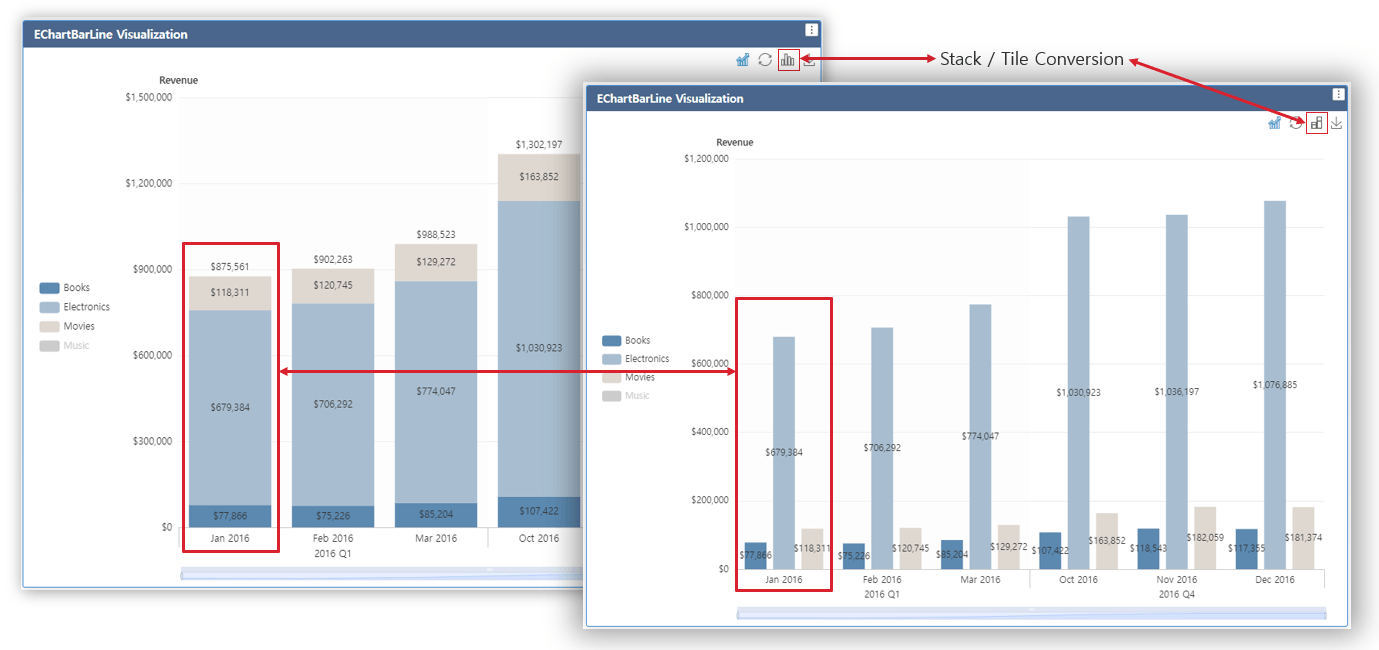
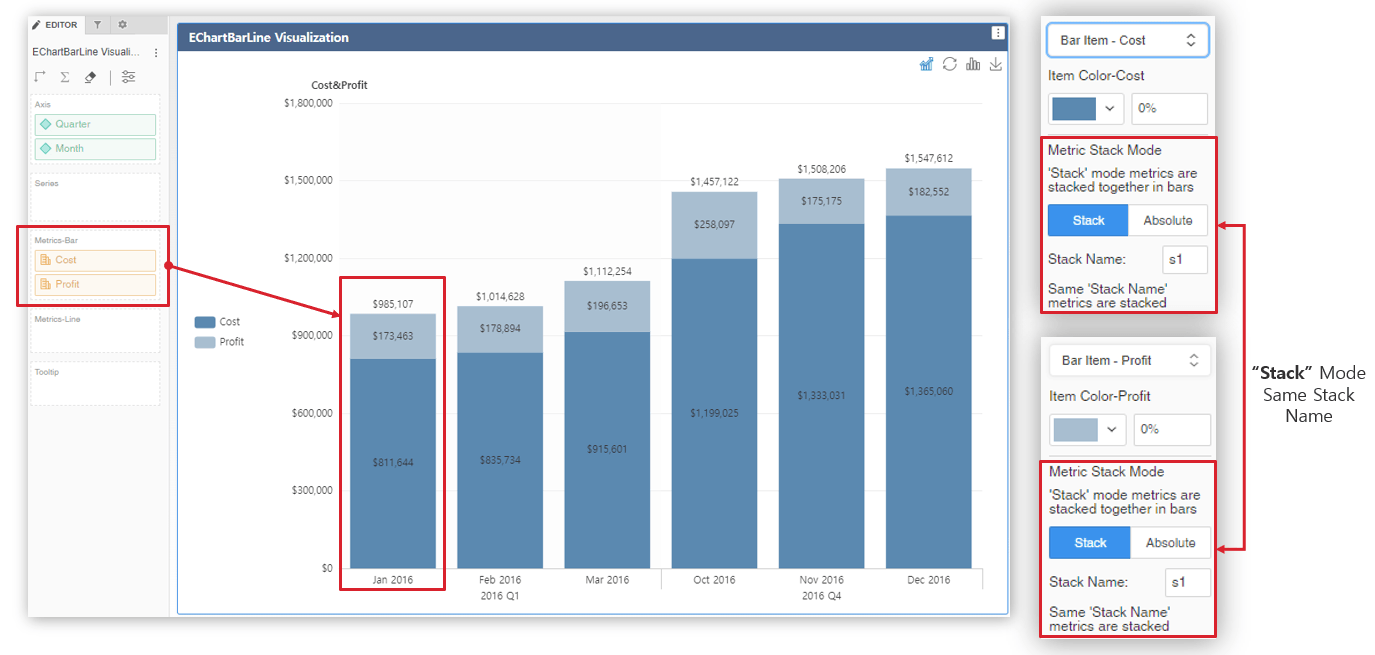
2. Bar Chart Features
a) Total Value Comparison
b) Stacked / Tile (Absolute) Conversion
c) Multi-Metric Stacked Bar, Mixed Metric Mode (Stacked & Absolute)
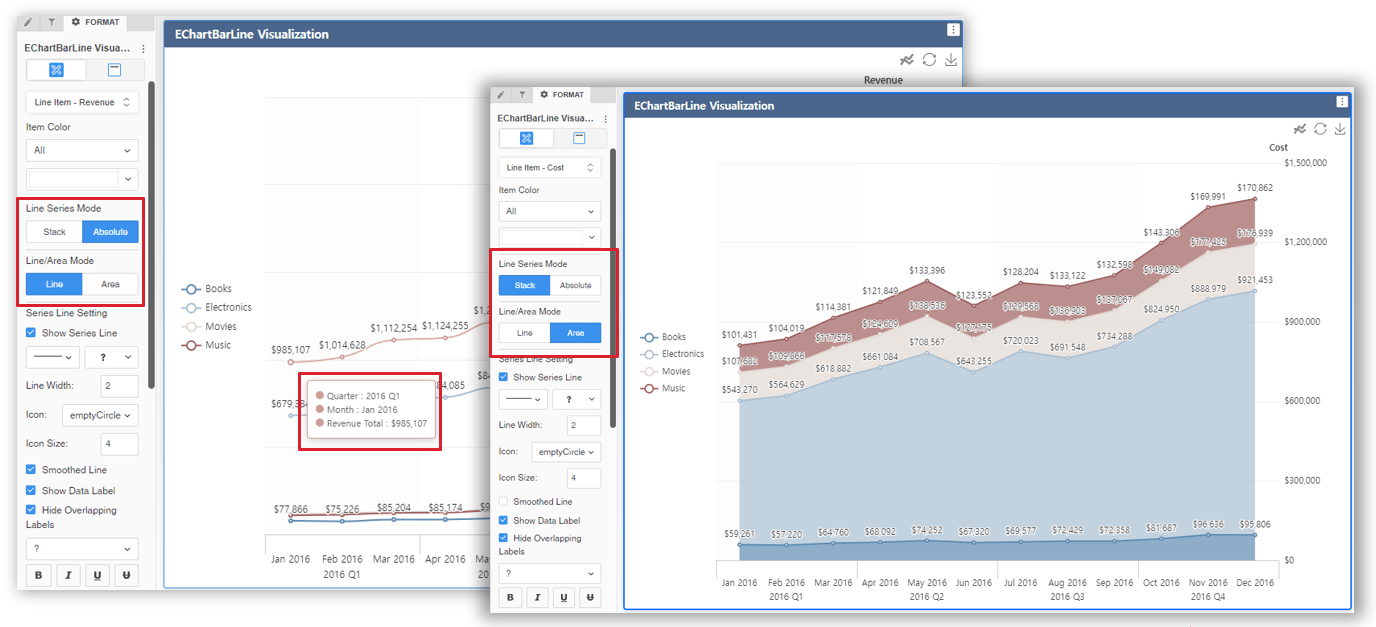
3. Line / Area Chart Features
a) Stacked & Absolute Line / Area, Total Value Line / Area
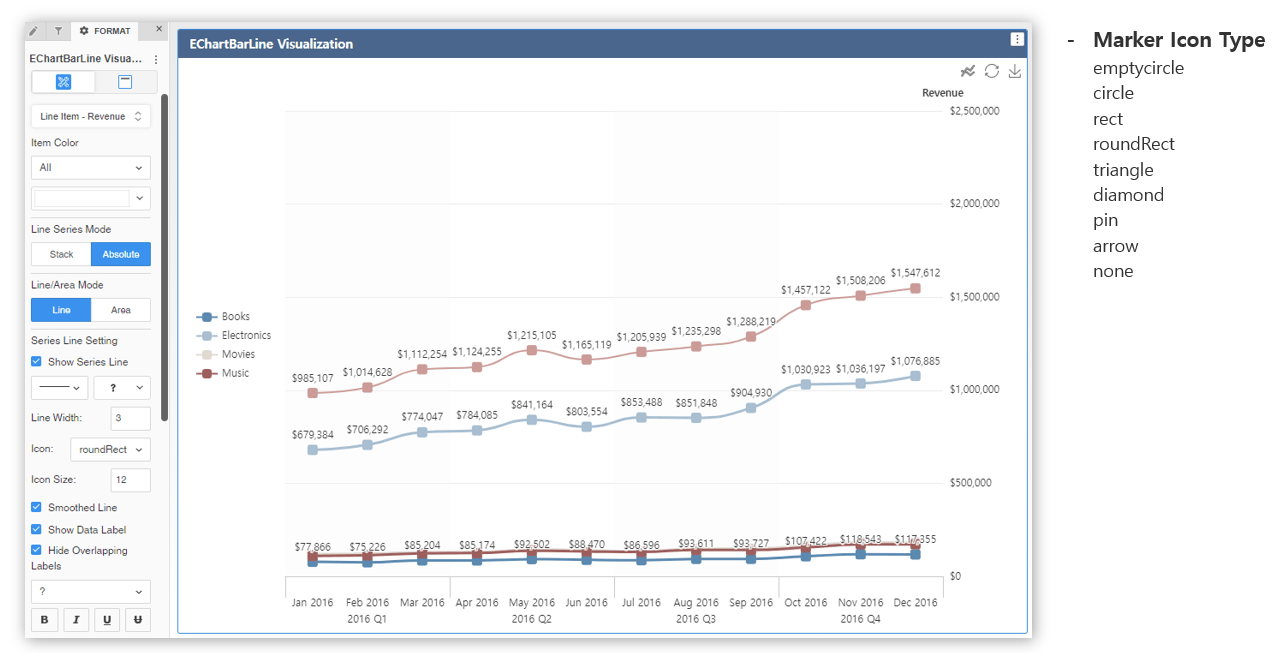
b) Provide Various Marker Icon Type and Synchronize Marker Icon to Legend
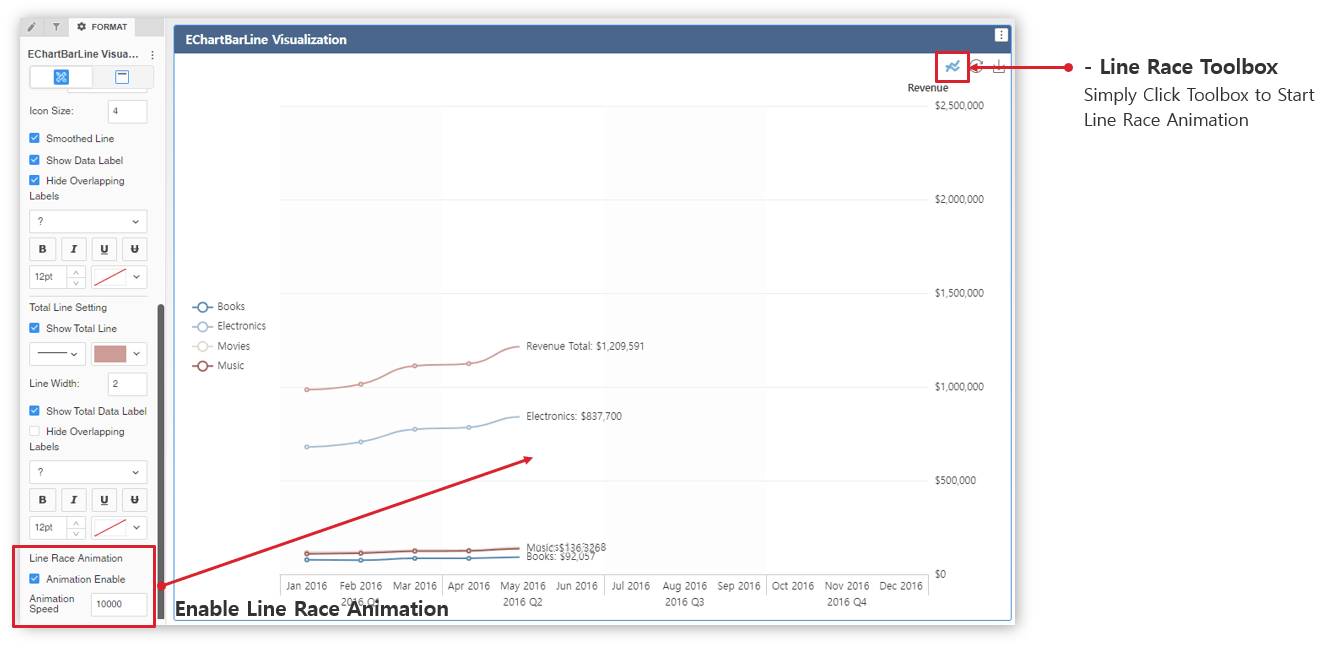
c) Line / Area Race Animation
Installation Instructions
1) To install this visualization, download the .zip file attached to this article and deploy it in Strategy Workstation, Strategy Web, or Strategy Library.
2) After you have installed the visualization, you can open a working demo of this visualization by uploading the .mstr file attached to this article and doing the following actions:
a) Open the demo visualization in Strategy Workstation, and double-click the .mstr file. (The attached .mstr file is built in Strategy 2021 Update9)
b) Open the demo visualization in Strategy Web, choose Create -> Upload Strategy File -> View Dashboard
Strategy Version
* Tested on Strategy 2021 Update9
Strategy Features
1) PDF Export
2) Set Target Visualization
3) Set Target Page & Dossier
Publisher: JinHyung Lee (Senior Sales Engineer in Strategy Korea)
IMPORTANT NOTE:
If you are having issues importing the EChartBarLine to Workstation there is a workaround way to:
1) Download EChartBarLine.zip and extract it.
2) Copy and Paste the folder to the Workstation plugins folder
ex) C:\Program Files\MicroStrategy\Workstation\Code\plugins
Visualization Disclaimer
By downloading or using this visualization, you accept and acknowledge these terms.
This visualization is both intended as sample code and provided as a convenience to Strategy users. Strategy cannot guarantee that the code provided will apply to any Strategy releases and clients outside of the versions stated within this article. This sample is supported by Strategy Technical Support up to and including the basic visualization functionality listed in this article. Defects will be triaged by the Strategy team as they are raised. For users with active Strategy Technical Support contracts, contact Strategy Technical Support to raise these defects.
Open Source
The Apache ECharts library is included in the visualization code.
For more information refer to the link: https://echarts.apache.org/en/index.html