Starting with the release of Strategy ONE (March 2024), dossiers are also known as dashboards.
How can my organization benefit from Library?
Let’s say you are a big-shot marketing executive at a firm in Silicon Valley that is constantly reviewing product information to drive campaign decisions. Sure, you’ve probably built your fair share of dossiers or documents, but you just need the insights—and you need insights fast. That’s where Library comes in—our viewing tool that helps users to view all of the data in one place.
How do I certify dossiers and push them to user groups?
If you have the privileges, you can certify dossiers and push them to users right from Strategy Workstation. Start by logging into an environment and follow these steps:
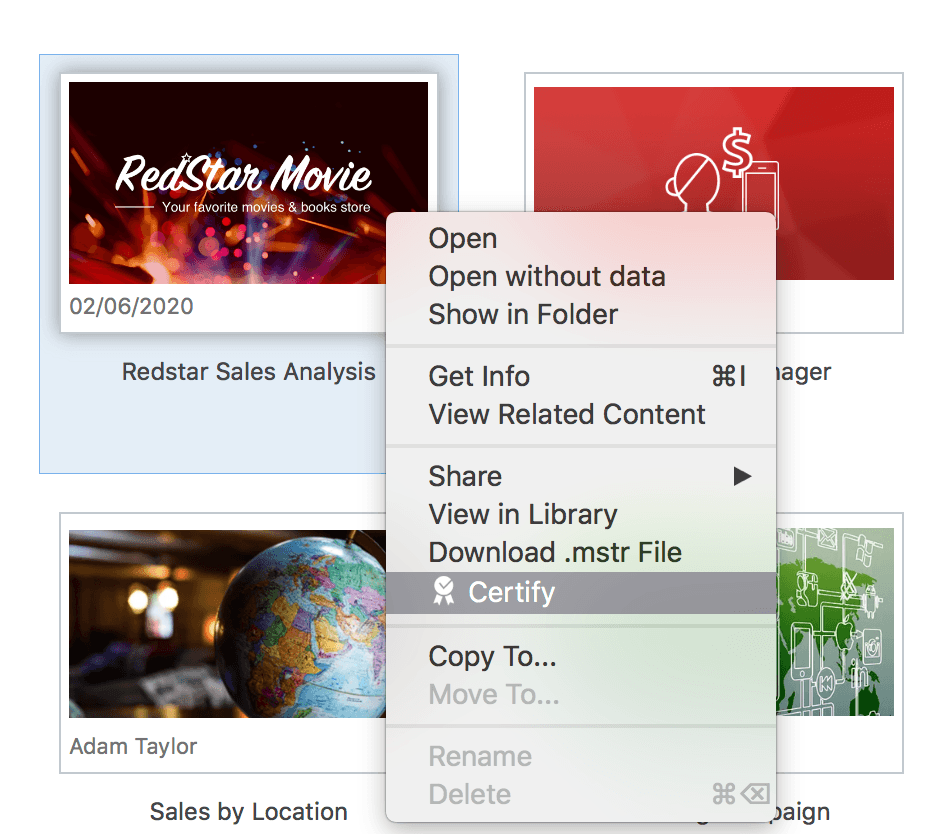
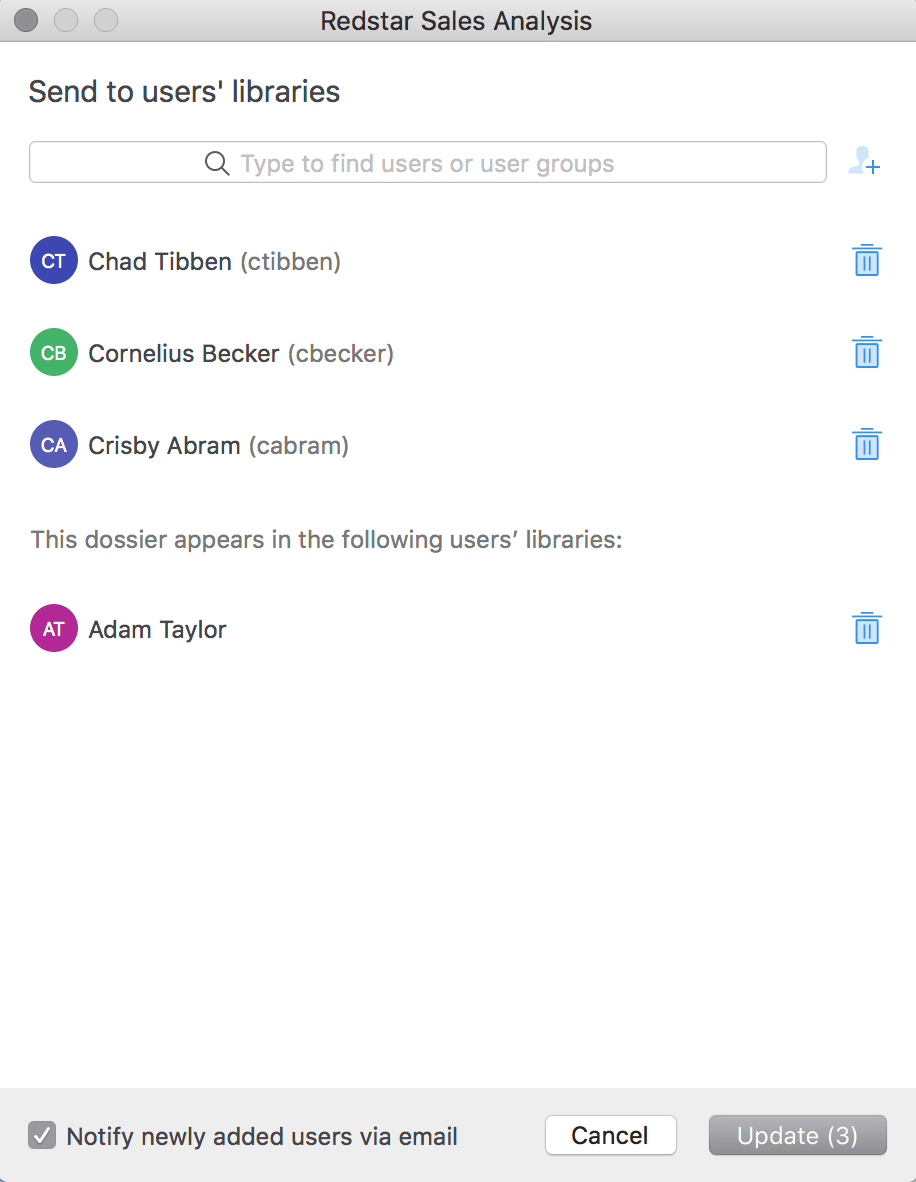
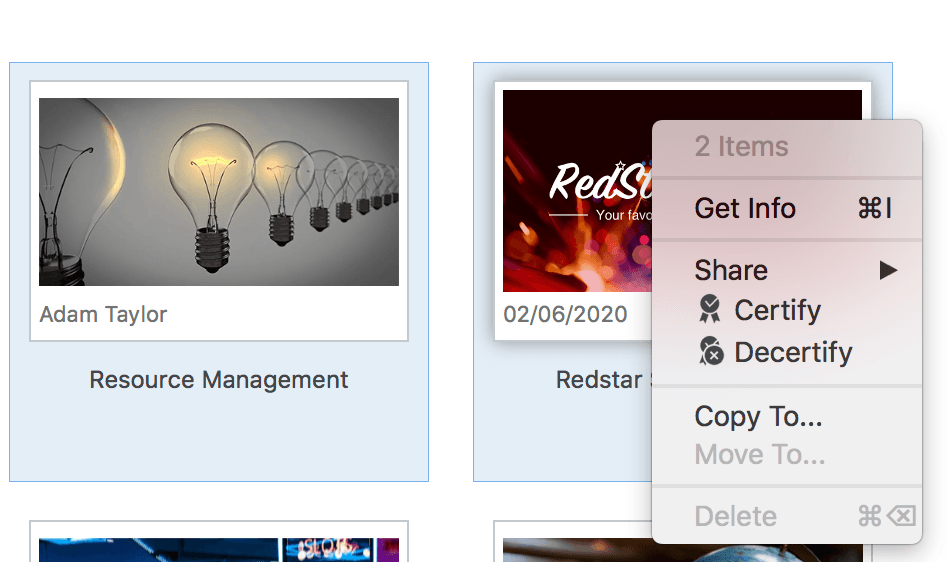
Helpful Hints: Use the multi-select feature in Workstation to push multiple dossiers at one time. To remove content from the users’ libraries, return to the Library Access panel and click the Trash icon.
How can I filter the data to get a specific view in Library?
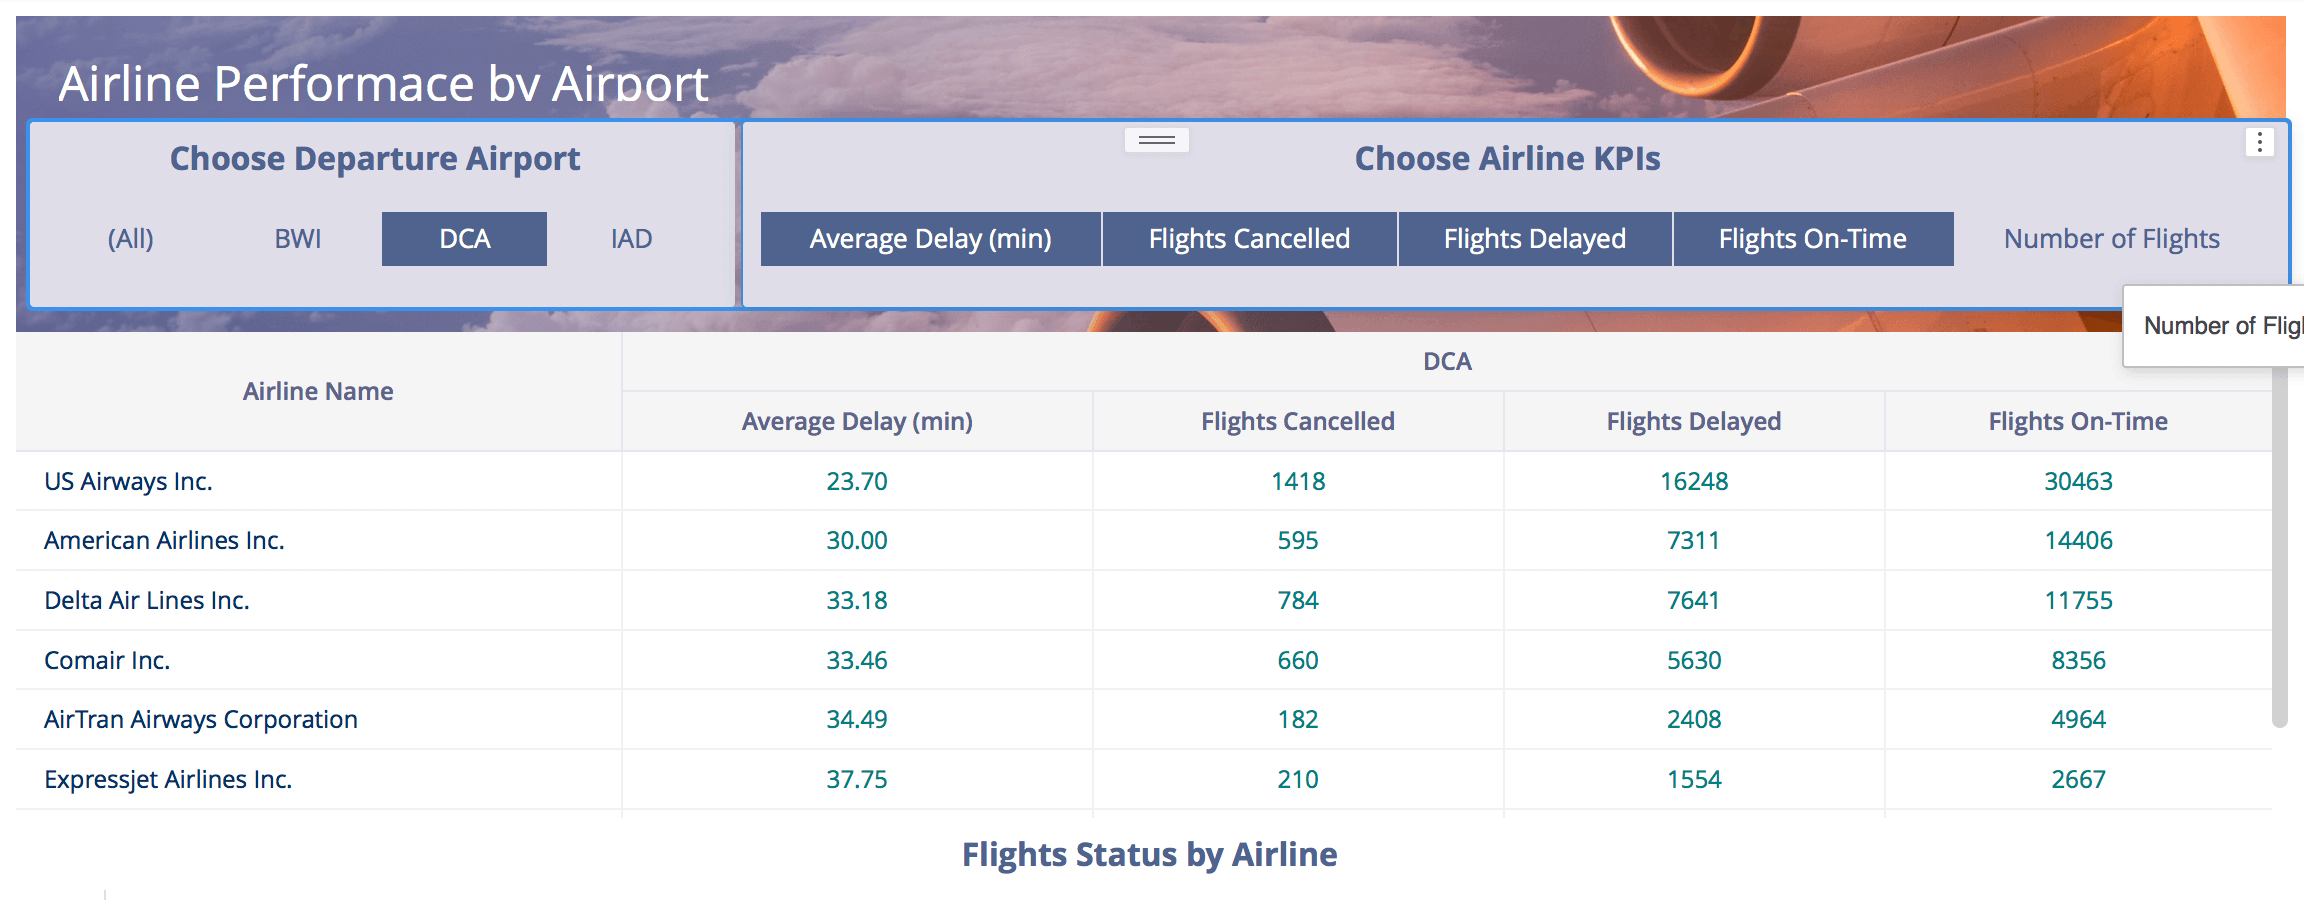
Today, there is an exponential amount of data. Making sense of the data is the key to driving both business value and overall revenue. In Library, users can view various visualizations, including maps, to get information at work or on-the-go. Though, the executive in our above example might be able to view the data at a high-level, filtering allows them to zone in on a specific attribute or client.
For example, the marketing executive can see the total amount of sales coming in as a result of the current campaign, but they want to zone in on the specific locations in the Northeast. In Library, they can filter down the Region elements to only the Northeast—the filter will affect all visualizations.
To filter, open a dossier in Library:
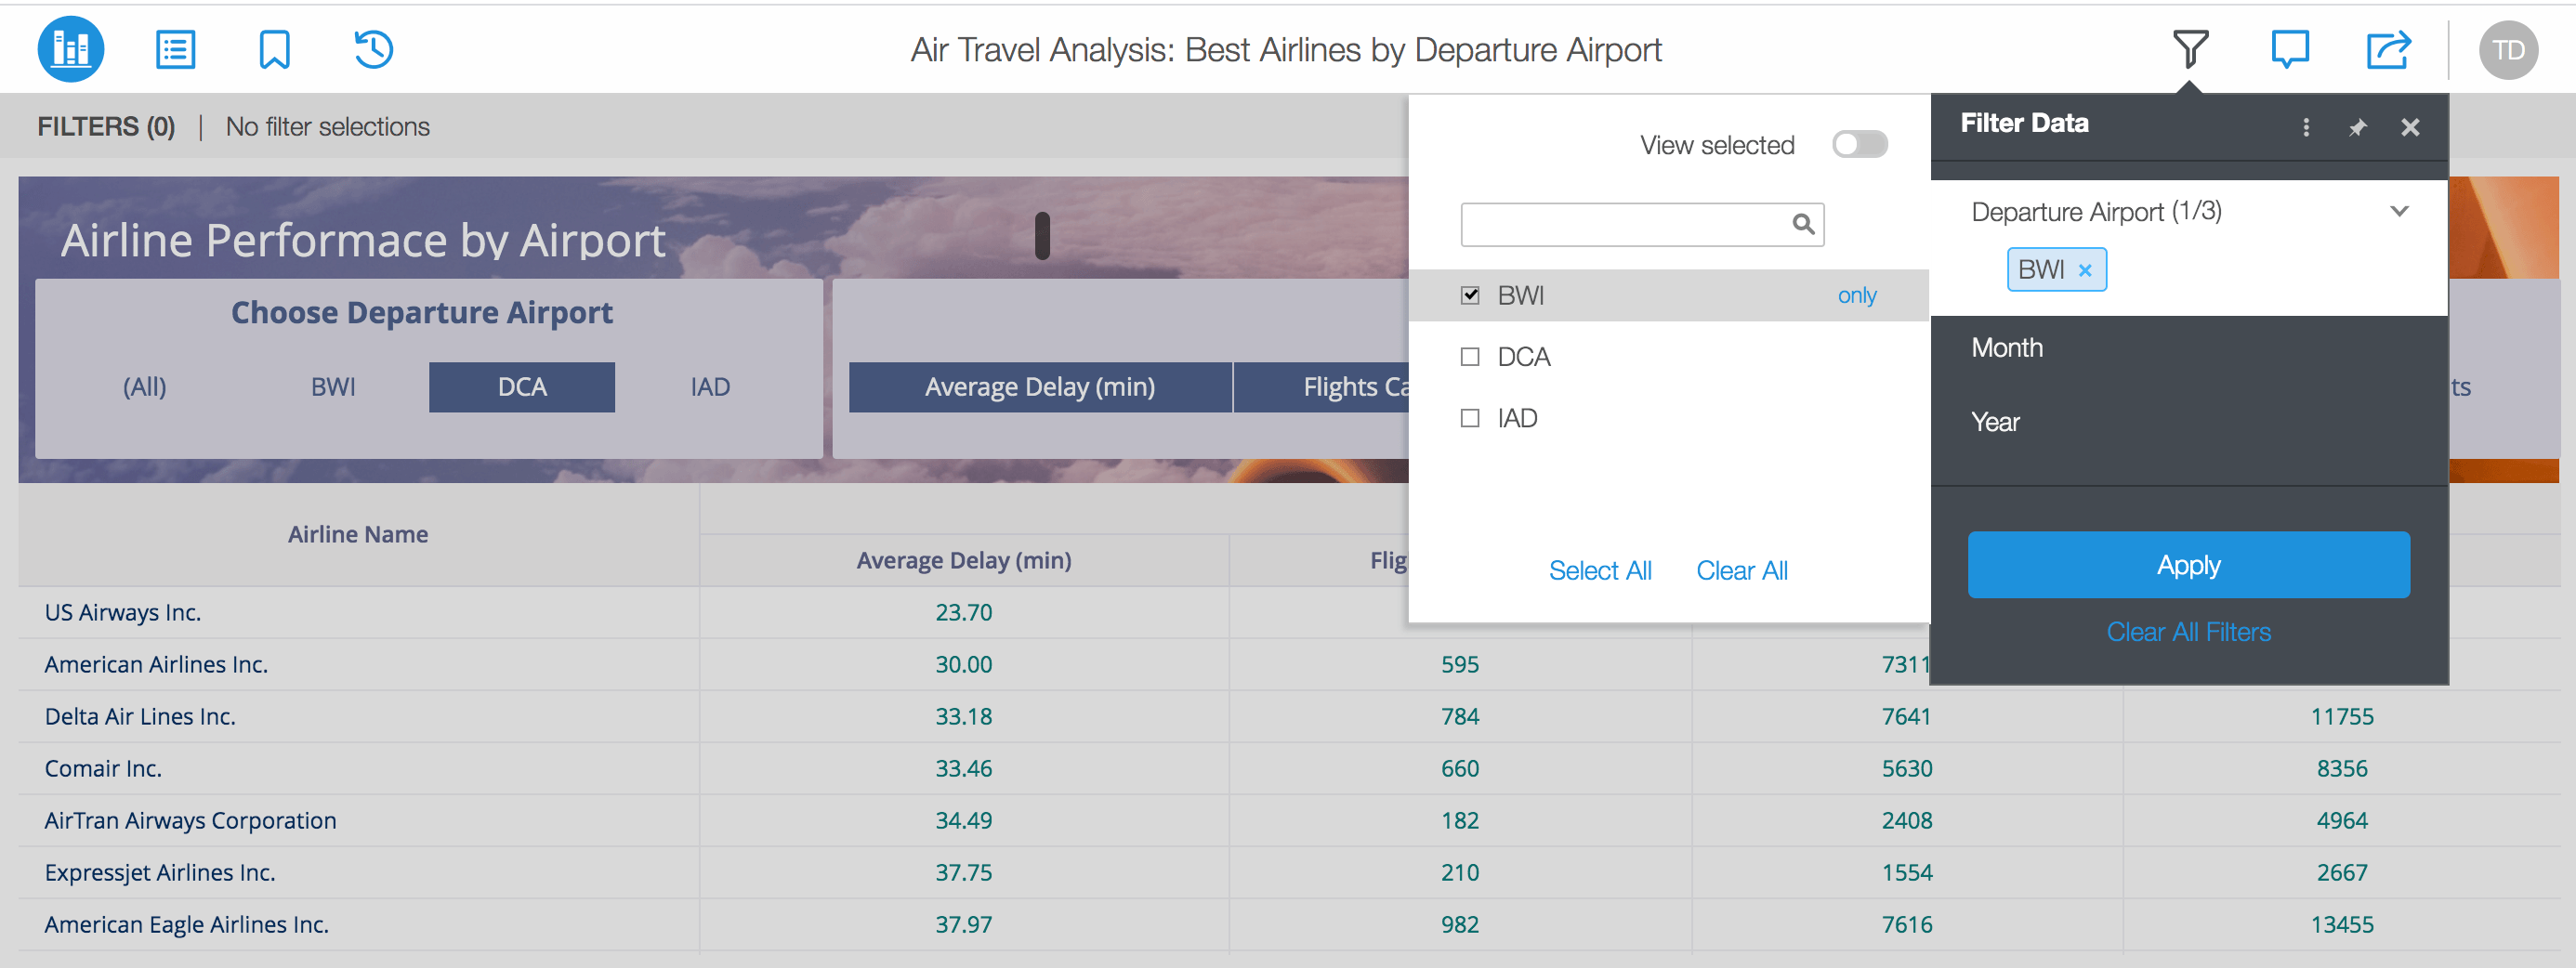
Helpful Hints: Pin the Filter panel to remain open during analysis by using the pin icon. You can also click on More (vertical ellipsis) to Hide or Show the Filter Summary directly on the page.
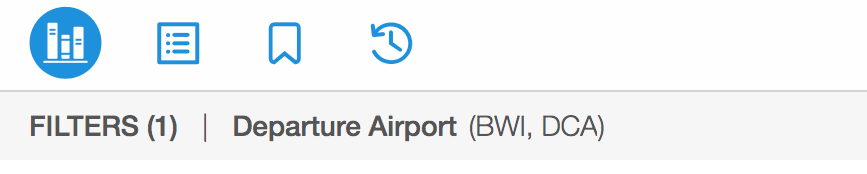
What’s the Filter Summary?
The Filter Summary shows all elements that have been selected on the page.
It appears directly at the top of the dossier.
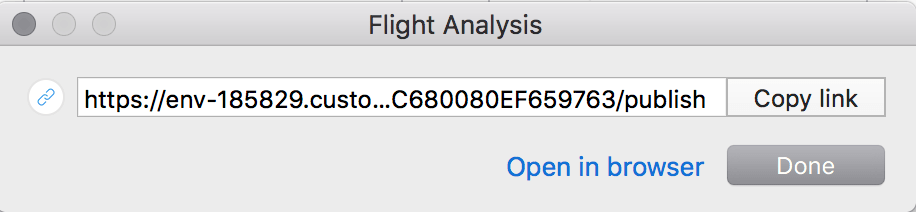
What’s the Library URL?
The Library URL is typically in the form of:
https://env-123456.customer.cloud.Strategy.com/StrategyLibrary.
However, sometimes this might look a bit different for some of our customers.
Helpful Hints: Workstation also uses the Library URL to connect to environments.
In Workstation, you can find the Library URL with these steps:

OR users can find the Library URL here:
What’s the difference between Bookmarks and Filters?
Great question—they’re pretty similar, but we say that a bookmark is a filter with edge. Bookmarks can include in-canvas filtering changes, exclusions in the visualizations, drilling, sorting, or other manipulations that the user makes when viewing the page.
Filters only include the chapter-level filters from the panel.
To create a Bookmark in Library:
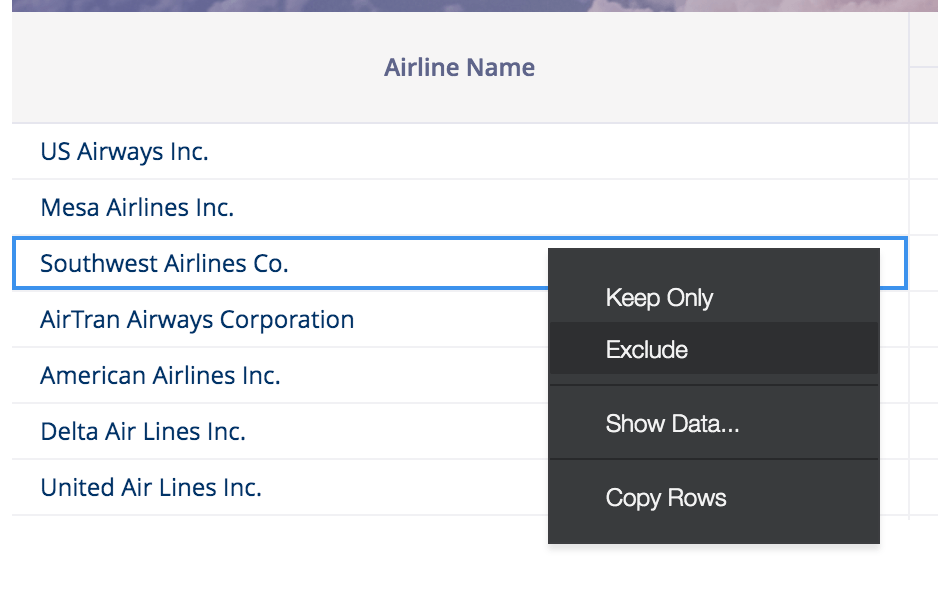
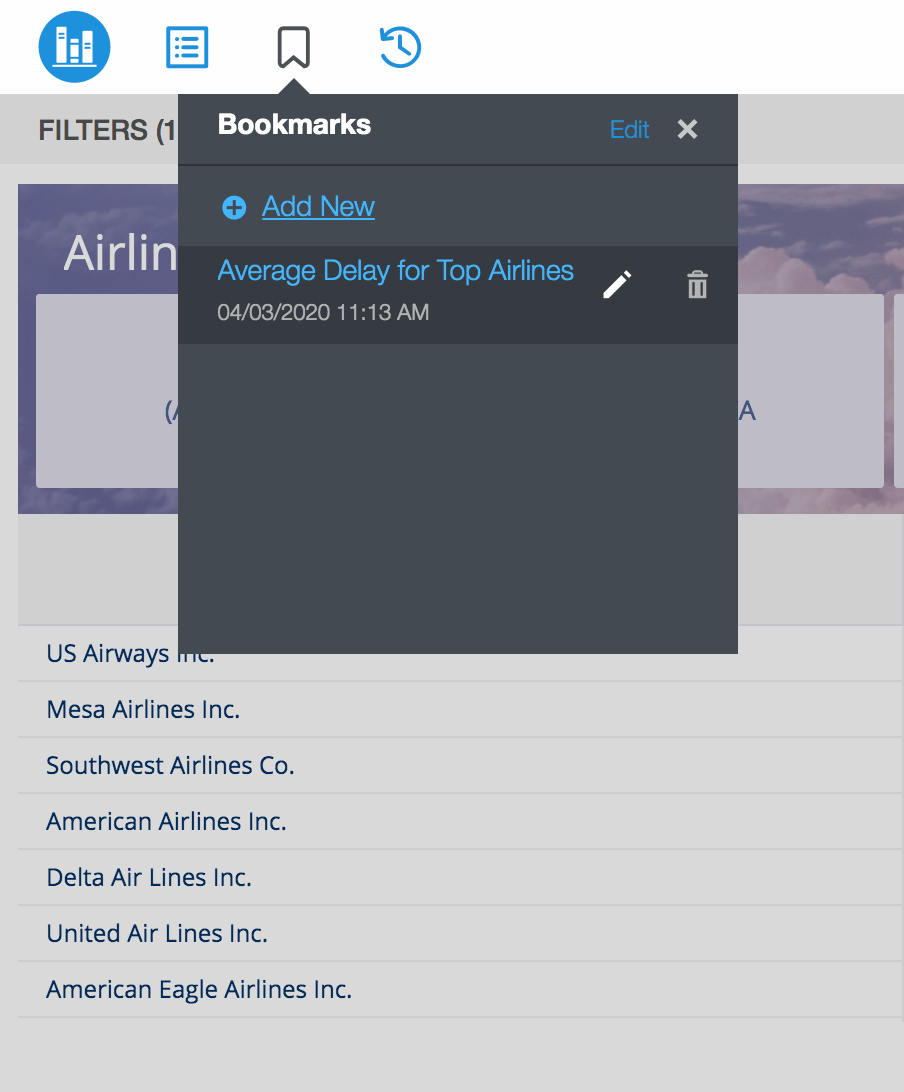
Helpful Hints: Use the Edit option at the top to delete bookmarks in bulk. Use the Edit option next to the bookmark name to make changes to the saved bookmark itself at any time. For example, you might exclude another airline in the grid. To update the bookmark after editing, use the Save icon.
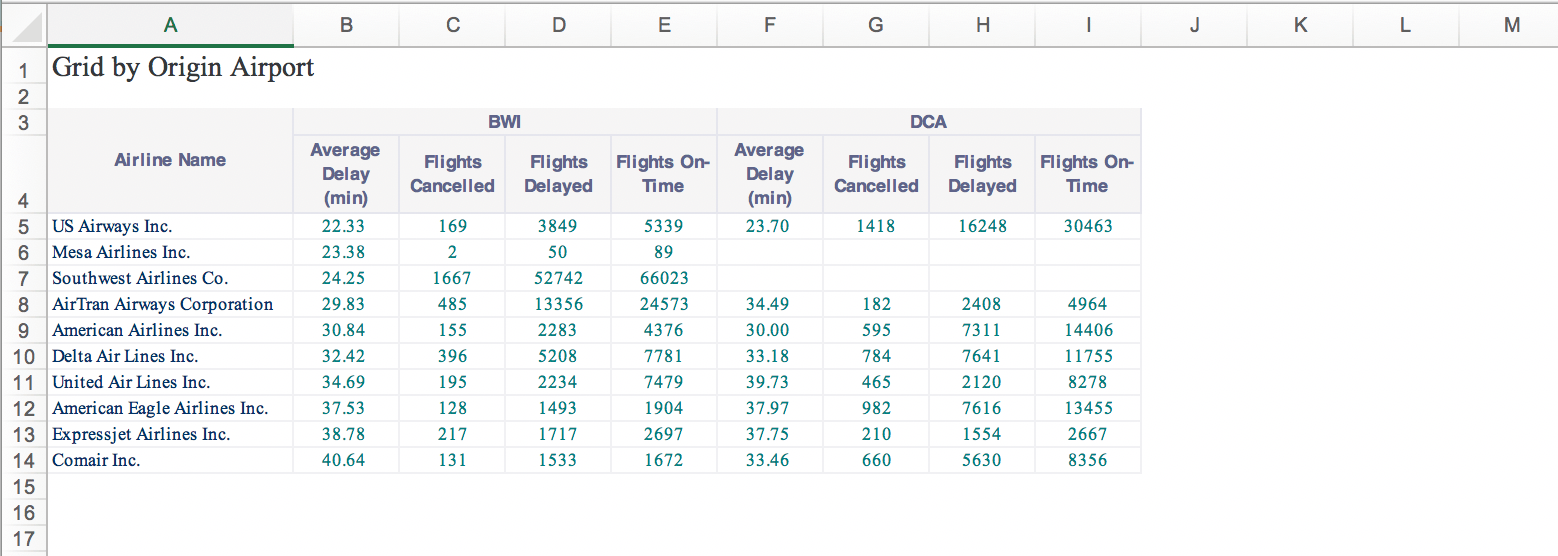
Is it true: can Library users Export to Excel?
Yes. Strategy has supported the export to Excel function for a while now, but in Strategy 2020 Update 1, we made Export to Excel more accessible and discoverable. This option helps our users to send information to other colleagues in various formats or download the Excel for further analysis.
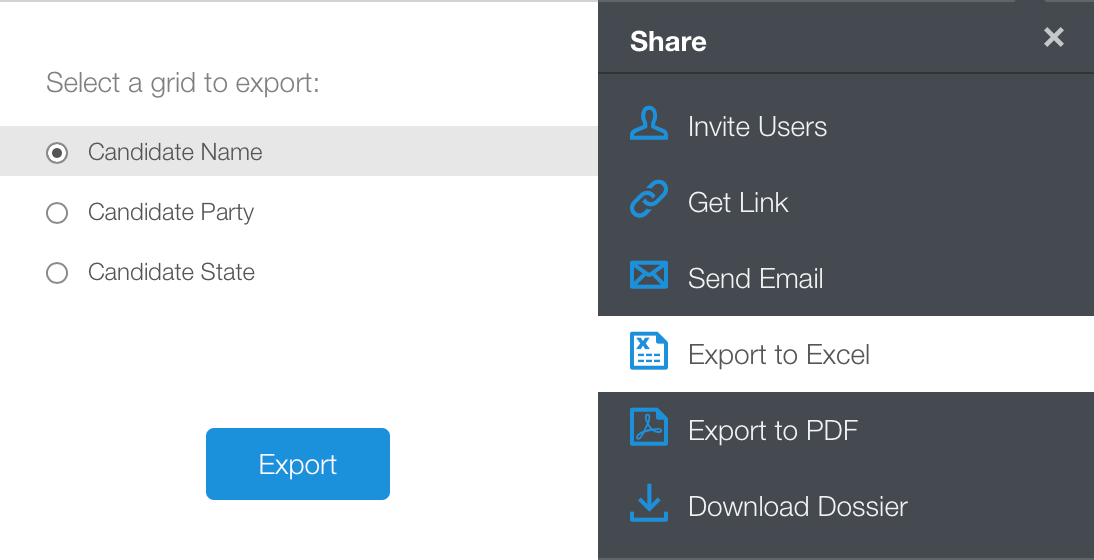
To export a grid to Excel format from the main menu:
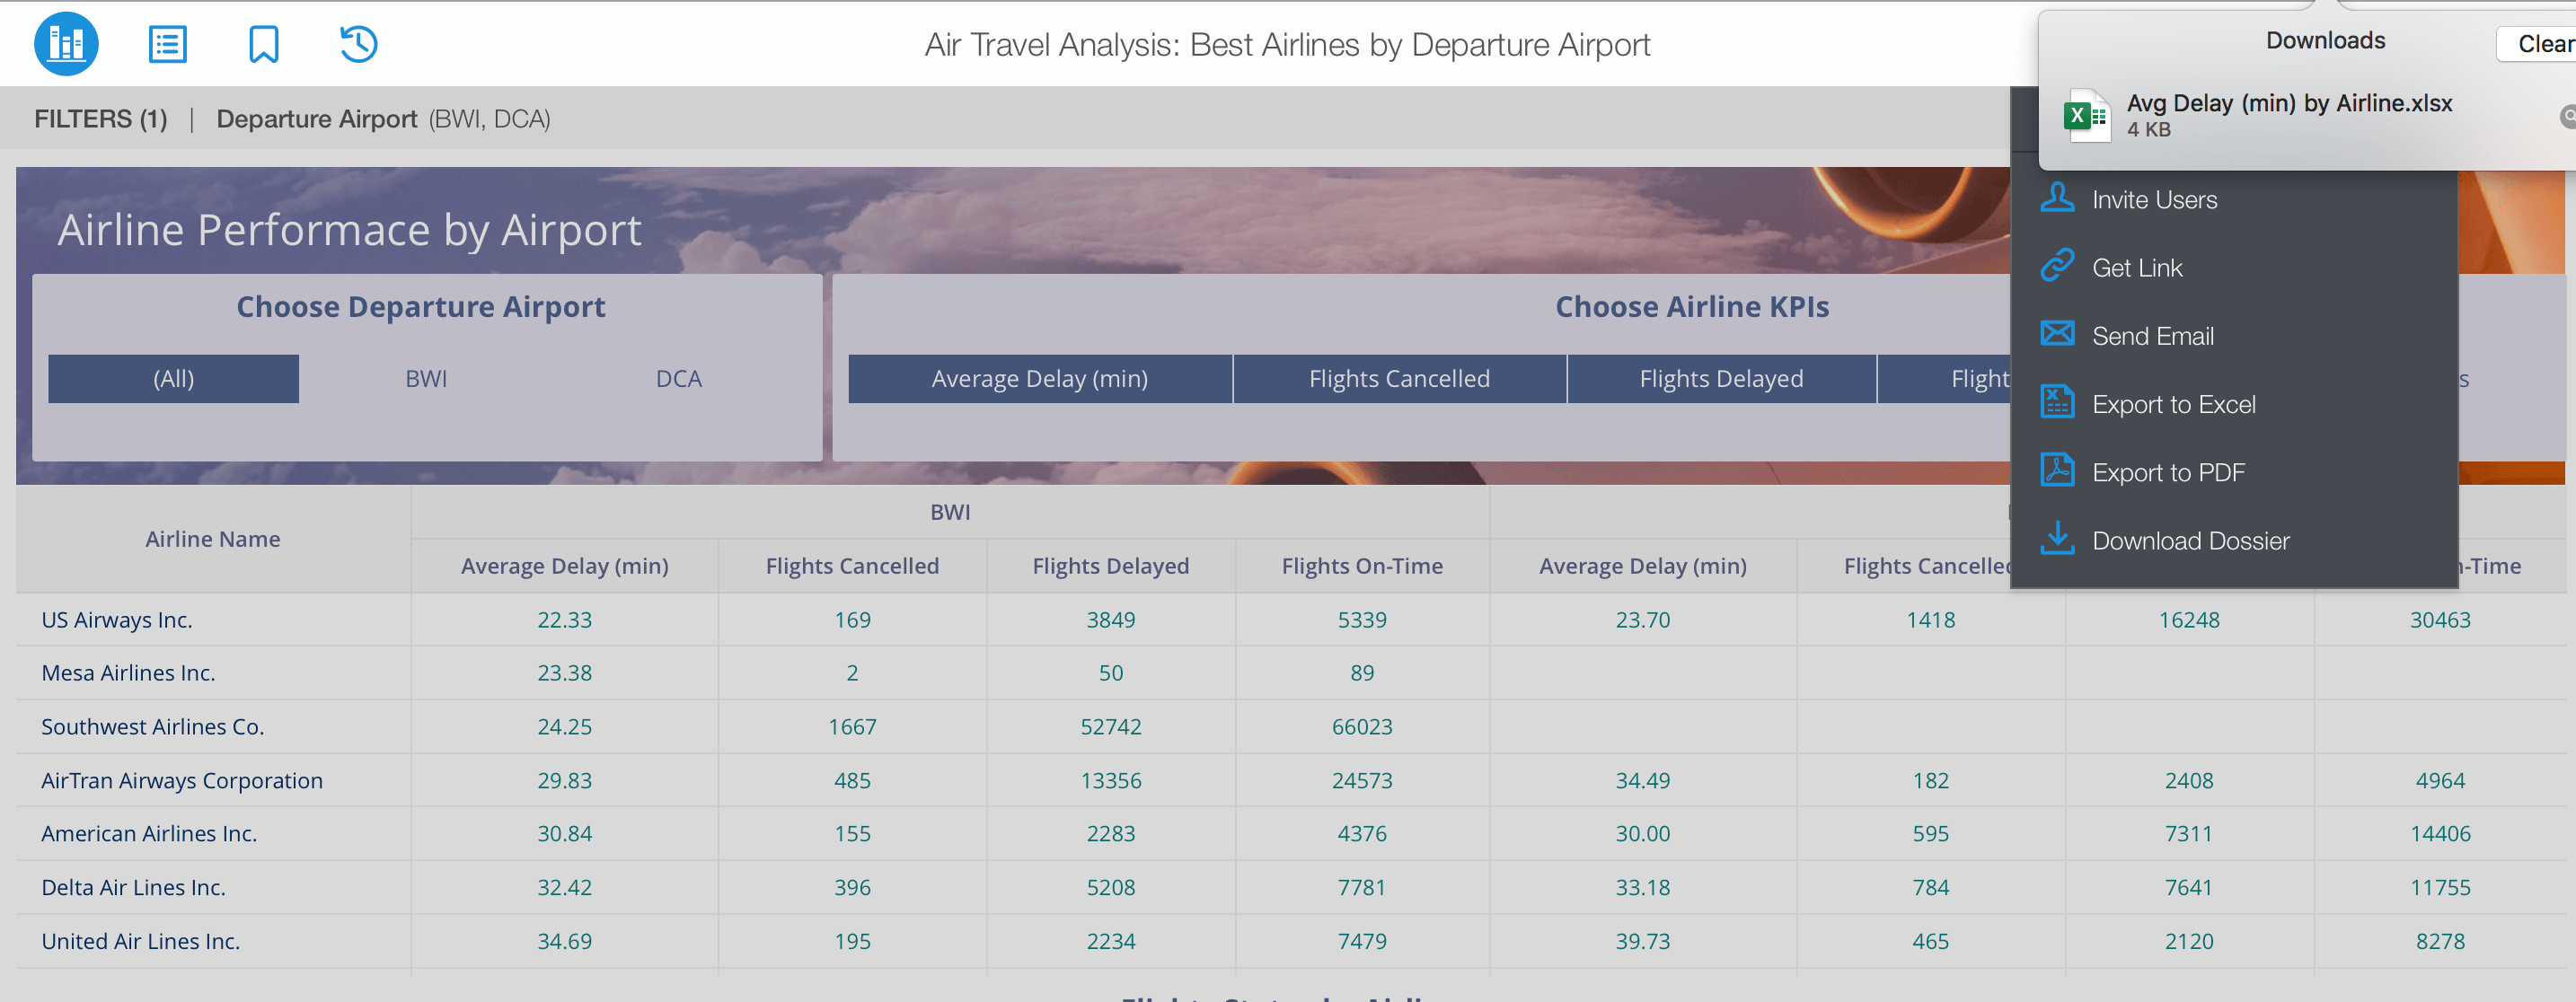
Helpful Hints: If multiple grids appear on a single page, the user will see a fly-out window that will allow them to select a specific grid to export. Only one grid export is supported at once.
Collaborate across the enterprise to make data-driven decisions
Collaborate—it’s simple, it’s easy. Collaboration is part of the Library experience that enhances the overall ability to share data insights quickly. Here at Strategy, we believe in speed and efficiency. Our main goal? To make sure your teams get the data they need to drive decisions.
To start collaborating and sending insights to colleagues:
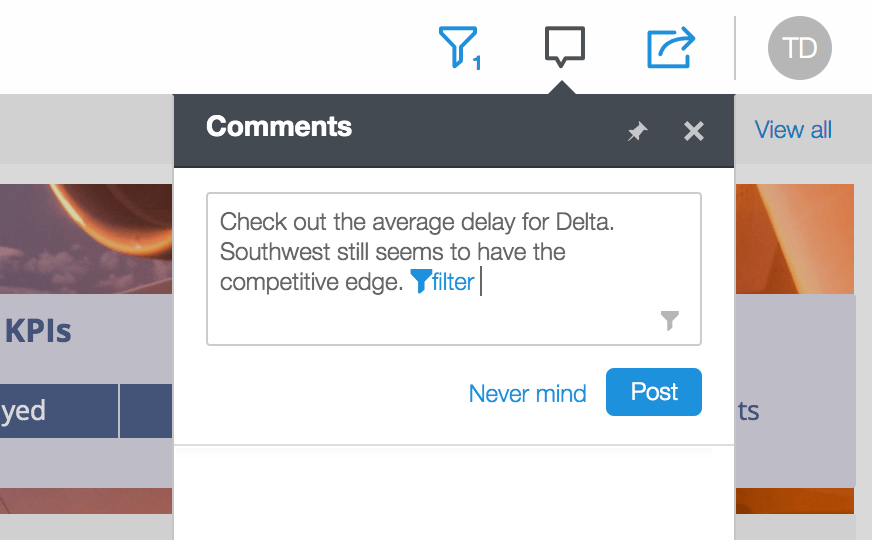
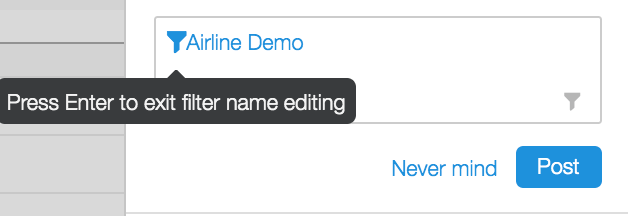
Helpful Hints: When adding a Filter into the comment, users can rename the filter for additional context. To do this, click on the text next to the icon and type the new name. Then, click Enter.
So, what’s the point of the Reset button in Library?
Great question—Reset allows the users to return to the original state of the dossier before any manipulations. You can find the Reset at the top of the dossier or under the Information icon of a dossier in Library Home. As you may have noticed in Library, there is no Undo or Redo options. This makes Reset an important feature. Until we support Undo and Redo, it is recommended to save different views as bookmarks until you find the one you want to save as the final bookmark. This helps users easily return to a previous state.
Tips for Library from the Authoring side of things.
Build interactive dossiers to enable easy navigation in Library
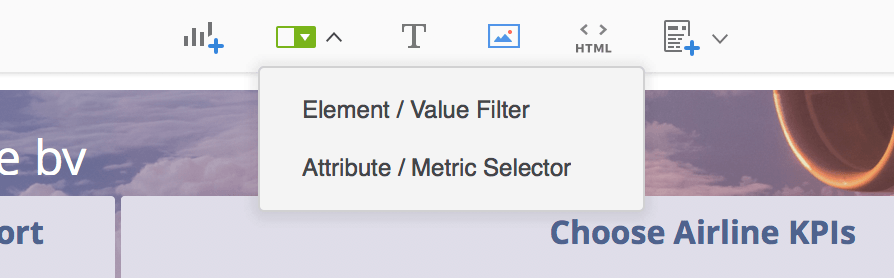
With new free-form layout, dossier authors have many design options to build for optimal data analysis. If you like to use grids, that’s great—super easy to get information at a fast pace. However, let’s add another dimension to that grid (literally)—try out the new Compound Grid (2020) that will allow you to view aggregated data across dimensions. Or you can use attribute-metric selectors to change the visualization view with a simple toggle across different attributes or metrics.
For example, the Library user may want to simply switch the combo chart to show Sales or Profit metrics with a simple click of a button.
To add an attribute or metric selector for Library viewing:
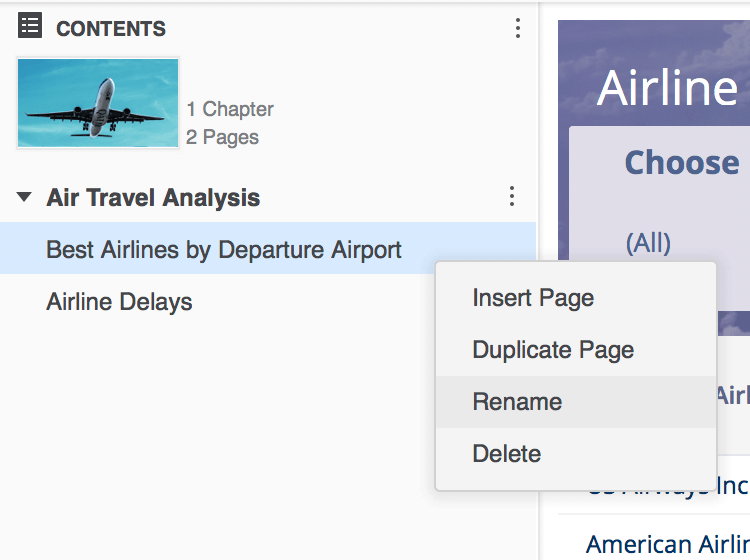
Name all chapters and pages to lead Library users
When building dossiers, try to think about what naming conventions and indicators would help your business users to navigate through the data. One of our biggest tips for analysts is to name the dossier’s chapters and pages with specific and easy to understand titles. When Library users are viewing the dossier, this makes it easier to find specific content faster.
To rename chapters and pages:
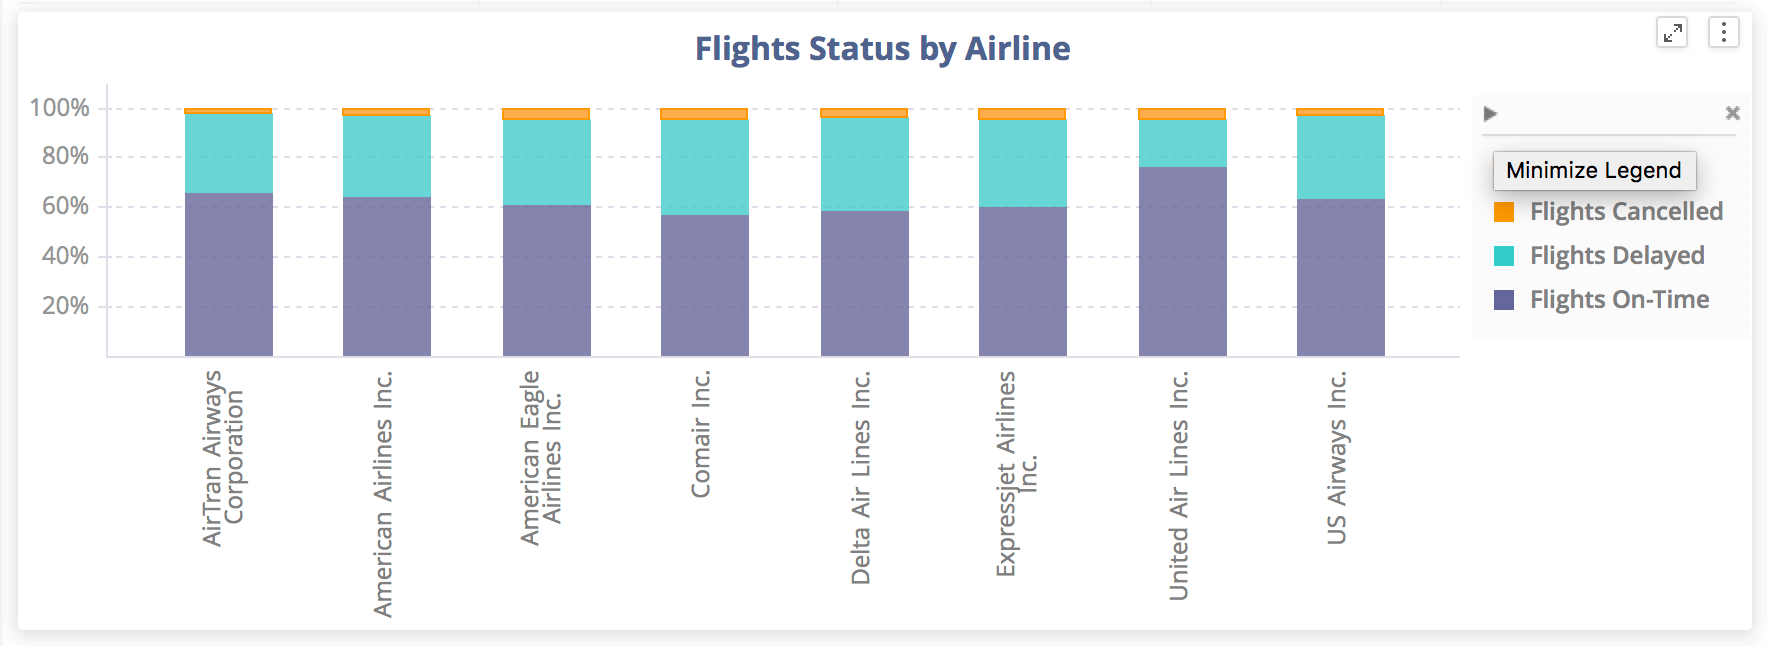
Collapse legends for sleek, modern appearance
Many visualizations in dossiers will have legends that are built to help users understand the different colors used in authoring. However, to save real estate in viewing and design for a cleaner Library page, some authors recommend minimizing the legend before sending the dossier to others. This allows for more space to see the actual data. And don’t worry…users can hover over the chart itself to get more information or even maximize the legend again later.
To collapse the legend of the visualization:
Stay tuned for insight into new 2021 features.
Learning Resources
Interested in learning more about Library with Strategy?
Visit the Learning Center on Community.