Starting with the release of MicroStrategy ONE (March 2024), dossiers are also known as dashboards.
Summary
Baidu ECharts is an open source JavaScript visual library which is supported by most of popular browsers (IE8/9/10, Chrome, Firefox, safari,etc). It brings data to life while gives users the full capability of customization.
This Knowledge Base article describes how to use Baidu ECharts to create custom visualizations and deploy it in your MSTR products. It also provides a demo project demonstrates how to parse MSTR data into data which can be used by Baidu ECharts and render a simple bar chart as example in the end.
Content
A sample Baidu ECharts visualization is attached in Related Section, to get a detailed explanation of how to create and use this sample visualization, follow the instructions below.
1. Deploy and leverage the sample visualization in MSTR products directlyTo view the sample visualization in a VI Dossier in MicroStrategy Web:
a. Download sample project MstrVisEcharts.zip
b. Abstract and copy paste the plug-in into the plugins folder under the MicroStrategy Web installation directory: <Local Path>\MicroStrategy\plugins
c. Restart your web server.
d. Open MicroStrategy Web and click Create New Dossier.
e. From the visualization gallery (vertical list of icons to the right of the Dossier), under Custom section, click the Bar chart with ECharts icon.
f. Import sampleDataset.xlsx, drag and drop attributes and metrics. The ECharts Bar Chart visualization is displayed in the VI Dossier.
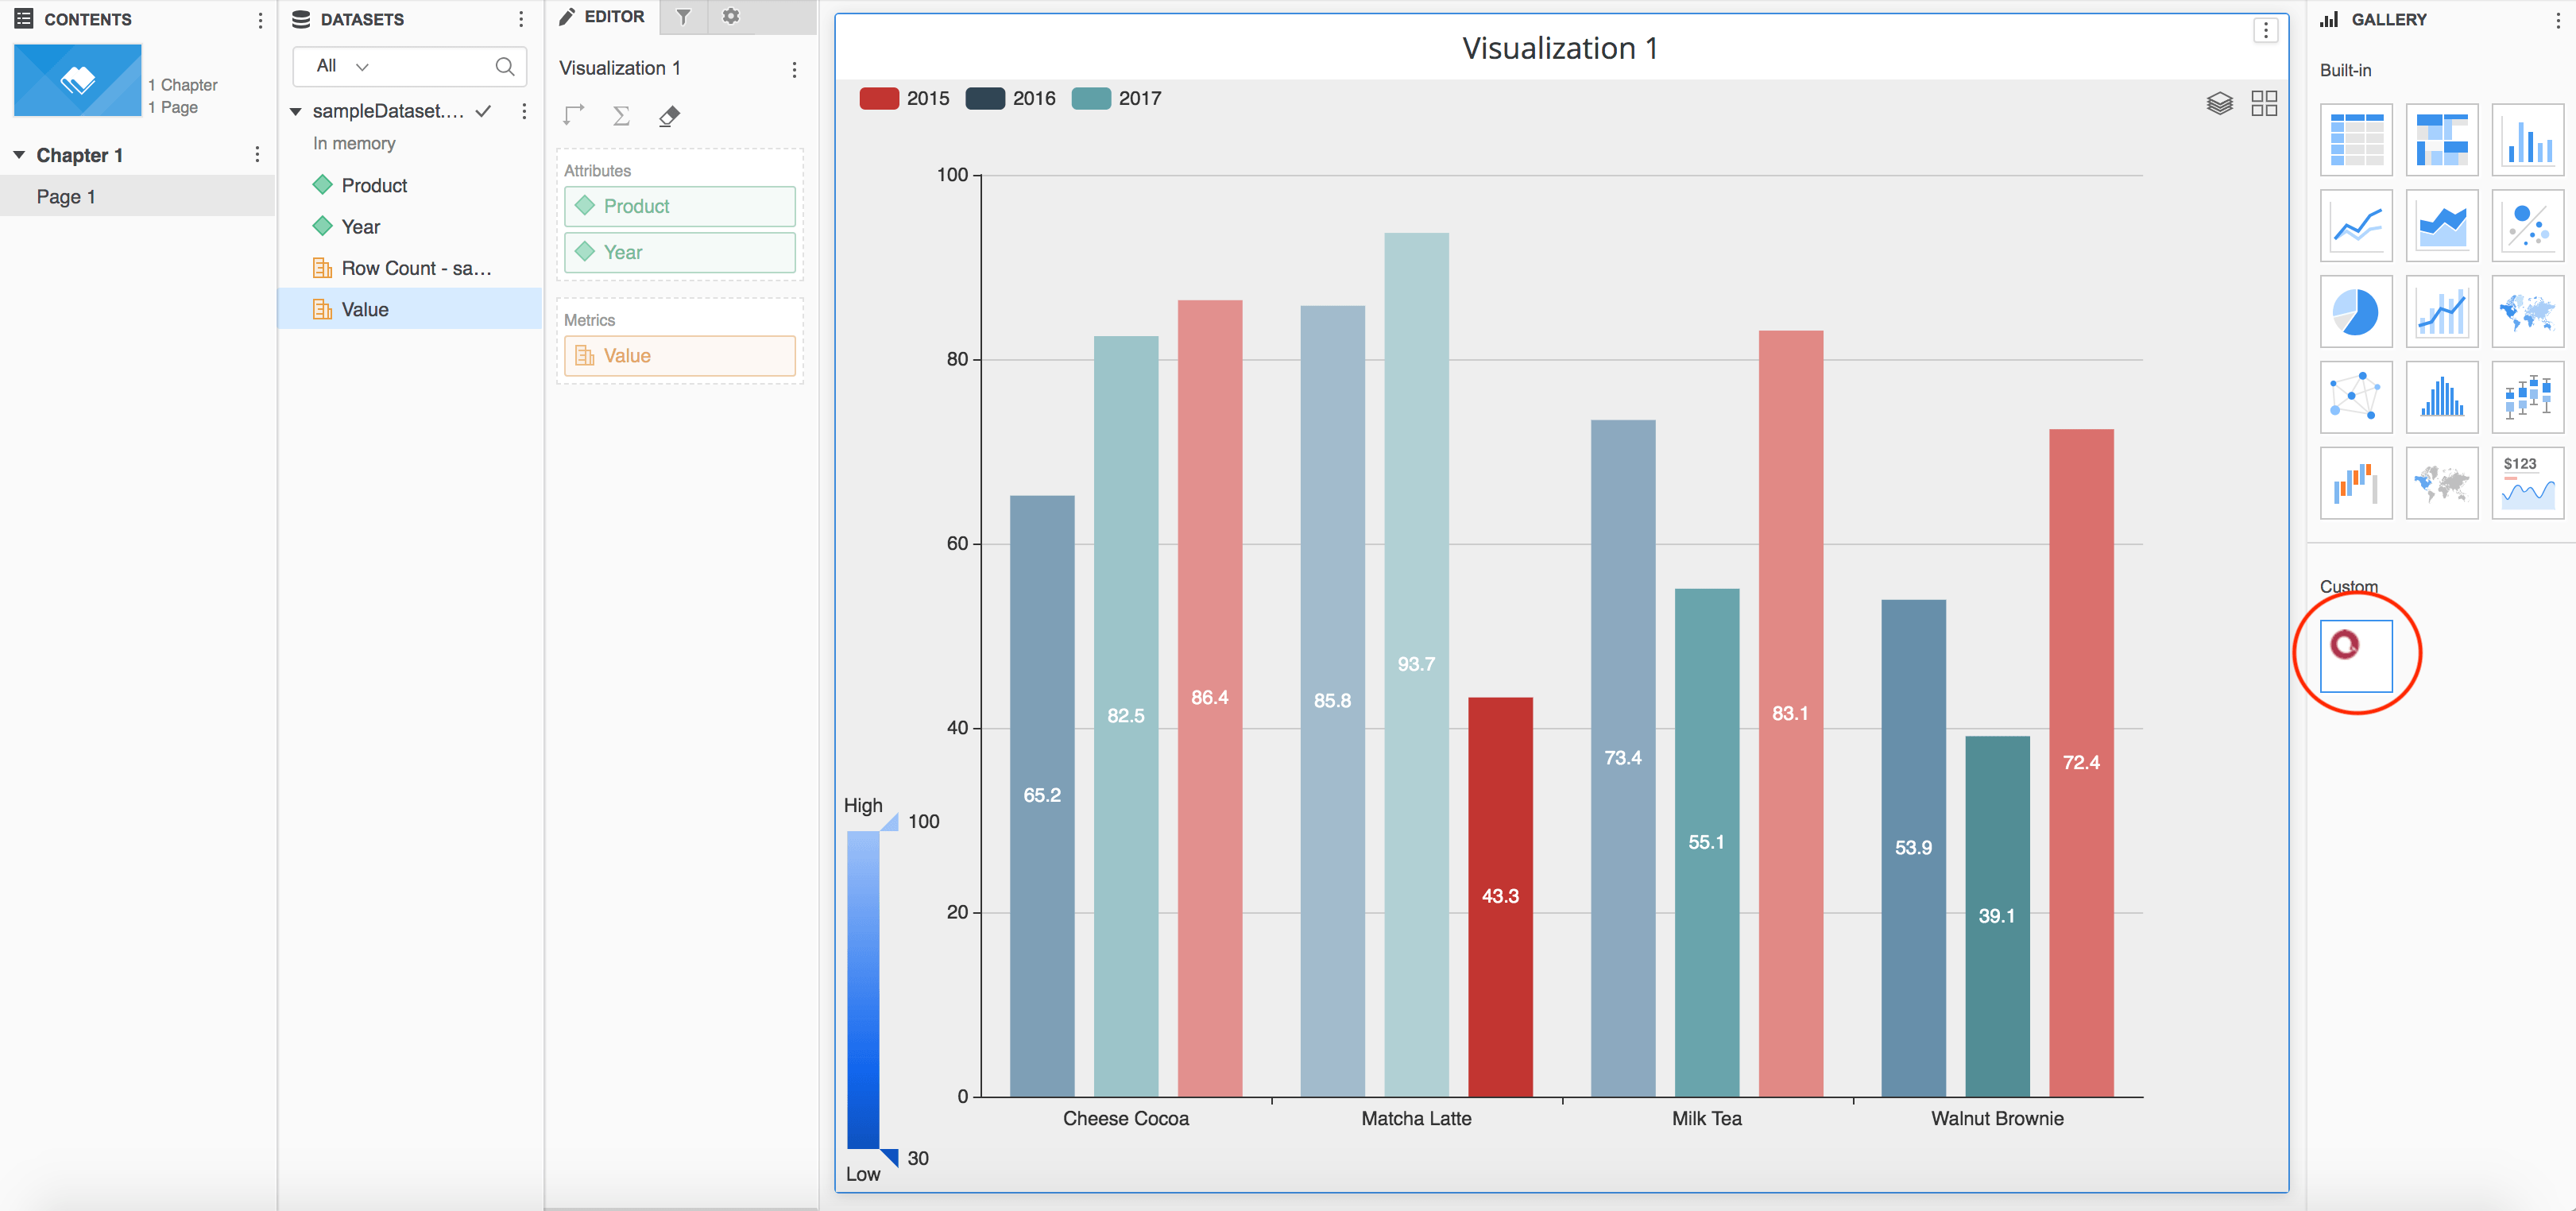
Other functionalities such as visual map, switching between stack/tile are developed based on ECharts API, refer to: https://echarts.apache.org/api.html#echarts
2. Demonstration on file structureMstrVisEchats sample project consists of basic structure code for integrating with MicroStrategy, general functions used for parsing MicroStrategy data in to data can be recognized by ECharts along with Baidu ECharts library “echarts.min.js”. This project has a file structure as below:

File name | Location | Functionality |
echarts.min.js | javascript/mojo/js/source | Official ECharts library, the latest version can be downloaded at https://echarts.apache.org/download.html |
MstrVisECharts.js | javascript/mojo/js/source | JS file contains main body code for rendering custom visualization |
global.css | style | CSS file used to render custom visualization |
Html5ViPage.css | style | CSS file used to render custom visualization's small icon in library |
Icon.png | style/images | Small icon |
visualizations.xml | WEB-INF/xml/config | XML file used to configure the show up of custom visualization in Library |
styleCatalog.xml | WEB-INF/xml | XML file used to configure the rendering of custom visualization |
Product | Year | Value |
Matcha Latte | 2015 | 43.3 |
Matcha Latte | 2016 | 85.8 |
Matcha Latte | 2017 | 93.7 |
Milk Tea | 2015 | 83.1 |
Milk Tea | 2016 | 73.4 |
Milk Tea | 2017 | 55.1 |
Cheese Cocoa | 2015 | 86.4 |
Cheese Cocoa | 2016 | 65.2 |
Cheese Cocoa | 2017 | 82.5 |
Walnut Brownie | 2015 | 72.4 |
Walnut Brownie | 2016 | 53.9 |
Walnut Brownie | 2017 | 39.1 |
Method | Functionality | Input | Output | Sample result |
function getAttributeNames(dataInterface) | Obtain all attribute names | dataInterface: data in MSTR format | Attribute name array | ["Product", "Year"] |
function getMetricNames(dataInterface) | Obtain all metric names | dataInterface: data in MSTR format | Metric name array | ["Value"] |
function getAttributeValues(dataInterface, attributeName) | Obtain all elements for specific attribute | dataInterface: data in MSTR format | Attribute element array | ["Matcha Latte", "Milk Tea", "Cheese Cocoa", "Walnut Brownie"] |
attributeName: attribute name | ||||
function getArrayData(dataInterface, attributes, metrics, restrict) | Obtain data, filter them based on constraints and assemble them into 2-d array matches ECharts series[i].data parameter | dataInterface: data in MSTR format | Each series[i].data can receive data in 2-d array format | See below examples |
attributes: attribute name array which decides the amount and order of attributes display in 2-d array | ||||
metric: metric name array which decides the amount and order of metrics display in 2-d array | ||||
restrict: filter conditions. Data will be filtered based on these conditions |
