Starting with the release of Strategy ONE (March 2024), dossiers are also known as dashboards.
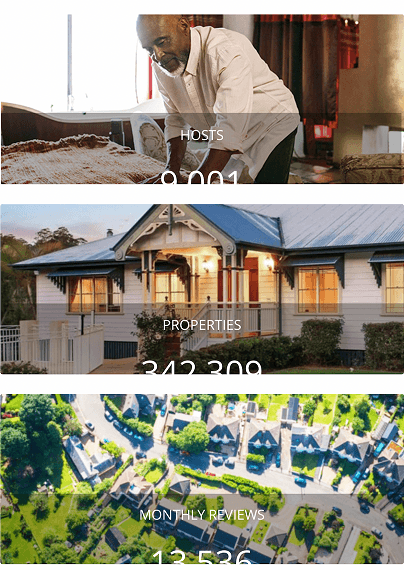
The following list details the best practices for designing an open canvas dossier to fit on a mobile device.
Best Practice for Using a Container as the Background of a Group
If you need to group two containers in one grow, it's recommended that you separate the grouped containers so they do not have any overlap.

This way, when you view the dossier on a mobile device, the contains will appear correctly side-by-side:

If the two grouped containers overlap at all, even if it is just white space that is overlapping, the grouped containers will appear incorrectly on a mobile device.

When the content overlaps, it appears overlapping on a mobile device:

If you need to add a longer textbox above another container, it's recommended that you separate the text from the lower container so they do not have any overlap.

This way, when you view the dossier on a mobile device, the contains will appear correctly side-by-side:

If the text and the container overlap at all, even if it is just white space that is overlapping, the grouped containers will appear incorrectly on a mobile device.

When the content overlaps, it appears overlapping on a mobile device:
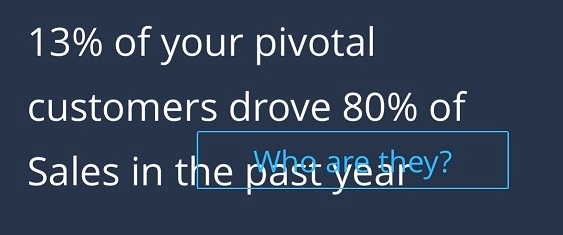
If you need to make one container the background of a group, it's recommended that you put all the containers inside the boarder of the background container.

This way, when you view the dossier on a mobile device, the background container will adjust its size based on the other container's sizes.

If you try to use a container as a background and do not put the additional containers inside the background container's boarder, the group will lose its background.

On the mobile device, the background container will not be recognized as a group background, so it will adjust its size based on its own content.

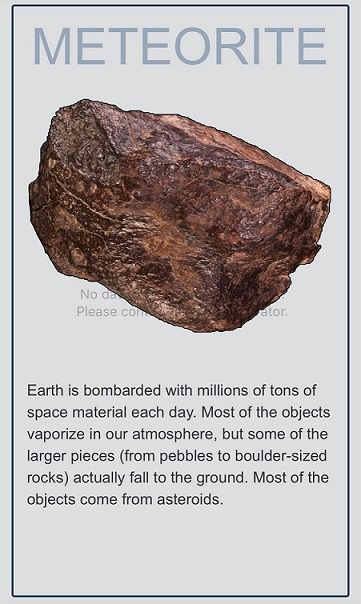
Additionally, it is not recommended to use a blank visualization container as a background image. If you do this, additional text will appear in the background.
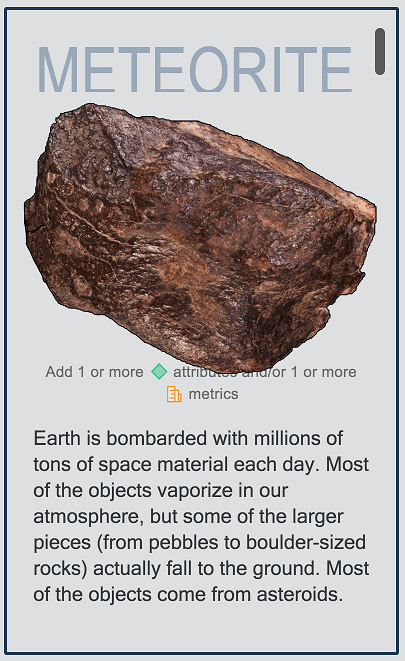
On a mobile device, the blank visualization will show an error message saying, "No data defined for this visualization. Please contact your administrator."
If you need to display metric values, it's recommended that you use a KPI to show single metric values.
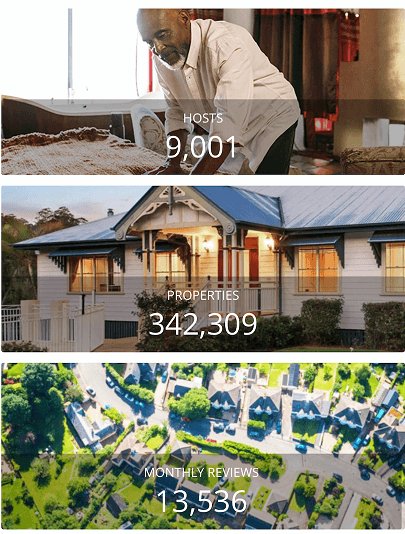
It's not recommended to use a Grid visualization to display single metric values. On a mobile device, the values will appear cut off in a Grid.