Starting with the release of Strategy ONE (March 2024), dossiers are also known as dashboards.
Butterfly Chart for Strategy Dossier
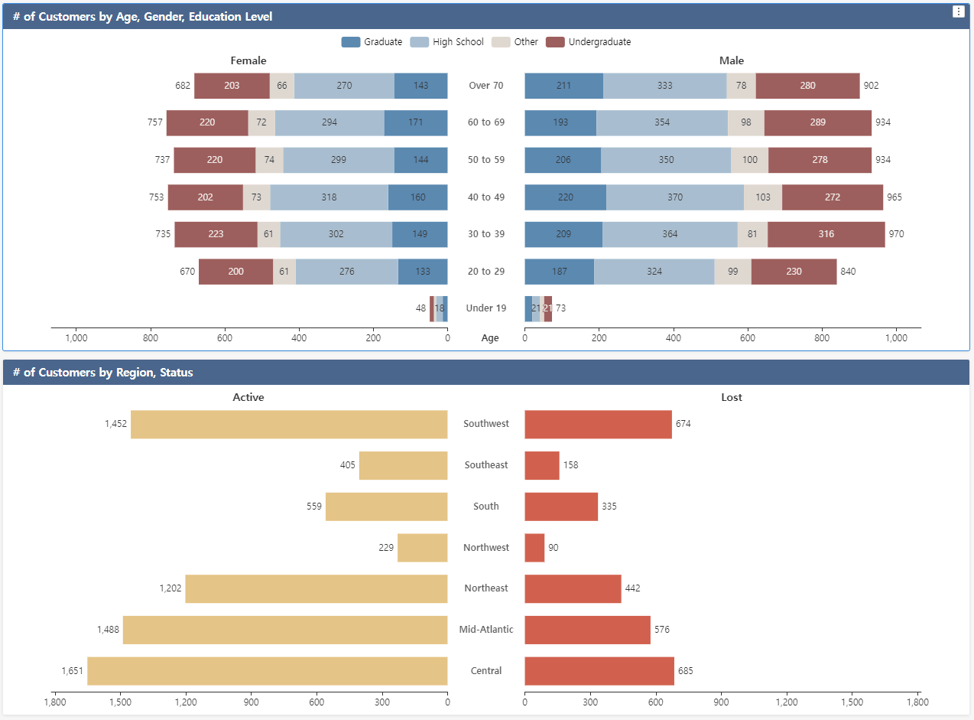
With this custom visualization you can easily create butterfly chart which is a type of bar chart where two sets of data series are displayed side by side.
It gives a quick glance of the difference between two groups with same y-axis.
This visualization is free to use.
Basic Usage
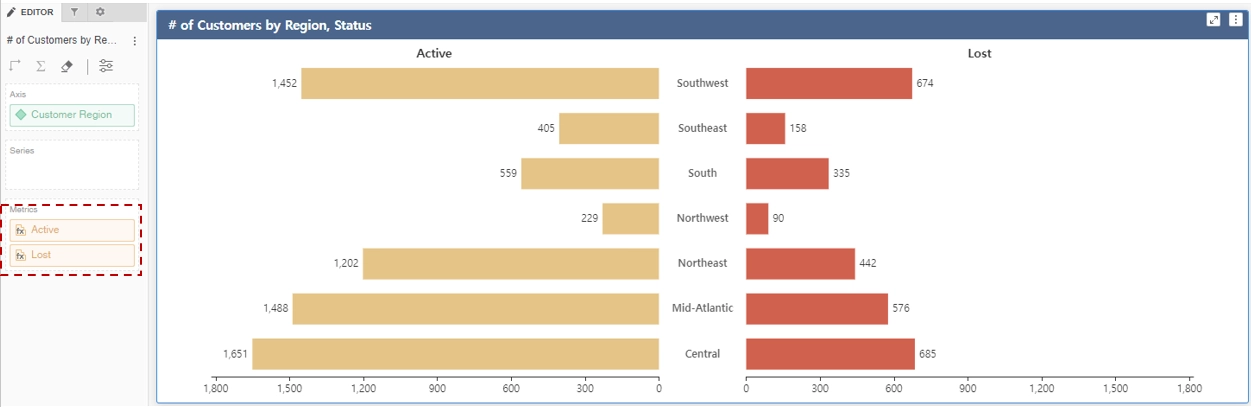
The visualization requires at least 1 attribute and 1 metric.
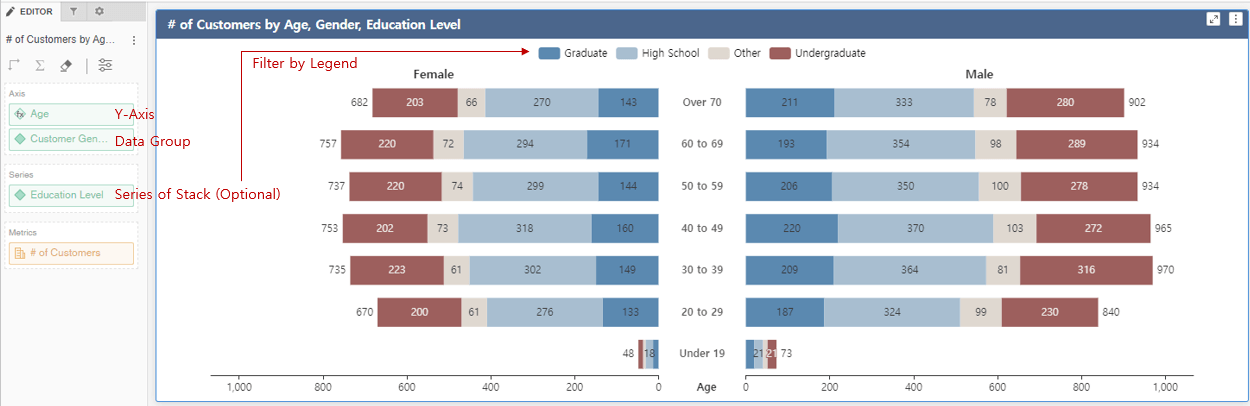
You can easily compare two metrics with same y-axis as below
Installation Instructions
• To install this visualization, download the .zip file below and deploy it in Strategy Workstation or Strategy Web.
• After you have installed the visualization, you can open a working demo of this visualization by uploading the .mstr file below and doing the following:
o To open the demo visualization in Strategy Desktop or Workstation, double click the .mstr file. (The attached .mstr file is bulit in Strategy 2021 Update2)
o To open the demo visualization in Strategy Web, choose Create -> Upload Strategy File -> View Dashboard
Strategy Version
* Tested on Strategy 2021
Strategy Features
* PDF Export
* Set Target Visualization
* Set Target Page & Dossier (Only on Web)
Publisher: JinHyung Lee (Sales Engineer in Strategy Korea)
Visualization Disclaimer
By downloading or using this visualization, you accept and acknowledge these terms.
This visualization is both intended as sample code and provided as a convenience to Strategy users. Strategy cannot guarantee that the code provided will apply to any Strategy releases and clients outside of the versions stated within this article. This sample is supported by Strategy Technical Support up to and including the basic visualization functionality listed in this article. Defects will be triaged by the Strategy team as they are raised. For users with active Strategy Technical Support contracts, contact Strategy Technical Support to raise these defects.
Open Source
Apache ECharts (https://echarts.apache.org/en/index.html) library is included in the visualization code