Starting with the release of Strategy ONE (March 2024), dossiers are also known as dashboards.
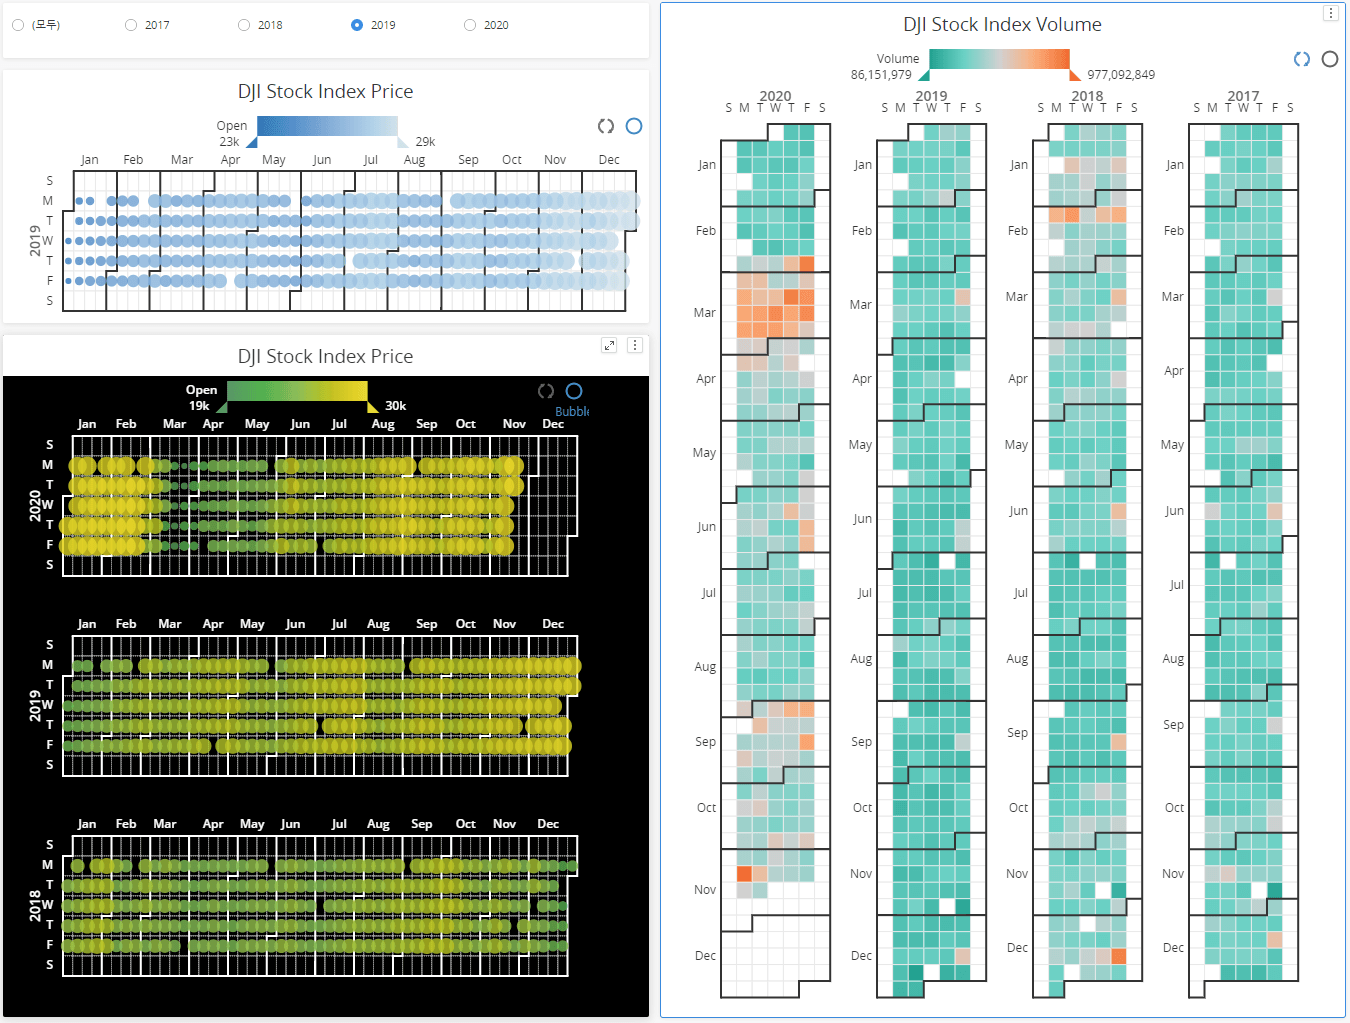
This Visualization requires at least 1 date attribute and 1 metric.
In this configuration, you can parse and assign date format to your data. For example, if your date format of the data is: 2020-12-23, You can set it to YYYY-MM-DD. If your date format is: 12/23/2020, you can choose it to be MM-DD-YYYY.
YYYY is for year digit , MM is for Month and DD is for date.
Also, you can choose Custom for your data format is not listed.
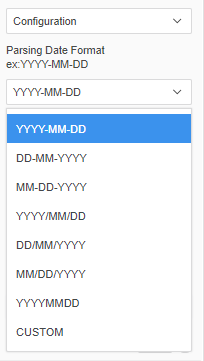
Sometimes it can't parse your data because it's parsed in client script. In that case , Please convert date format from the server side using date functions of Strategy.
It supports several options for format. Please refer below screenshot.
Strategy Version
* Tested on version m2020 and m2019 (2019 version is not support target different page feature)
Strategy feature
* PDF Export
* Set Target Visualization
* Set Target Page & Dossier (Only on Web)
Publisher: DongHyub Lee (Sales Engineer in Strategy Korea)
Visualization Disclaimer
By downloading or using this visualization, you accept and acknowledge these terms.
This visualization is both intended as sample code and provided as a convenience to Strategy users. Strategy cannot guarantee that the code provided will apply to any Strategy releases and clients outside of the versions stated within this article. This sample is supported by Strategy Technical Support up to and including the basic visualization functionality listed in this article. Defects will be triaged by the Strategy team as they are raised. For users with active Strategy Technical Support contracts, contact Strategy Technical Support to raise these defects.