Starting with the release of Strategy ONE (March 2024), dossiers are also known as dashboards.
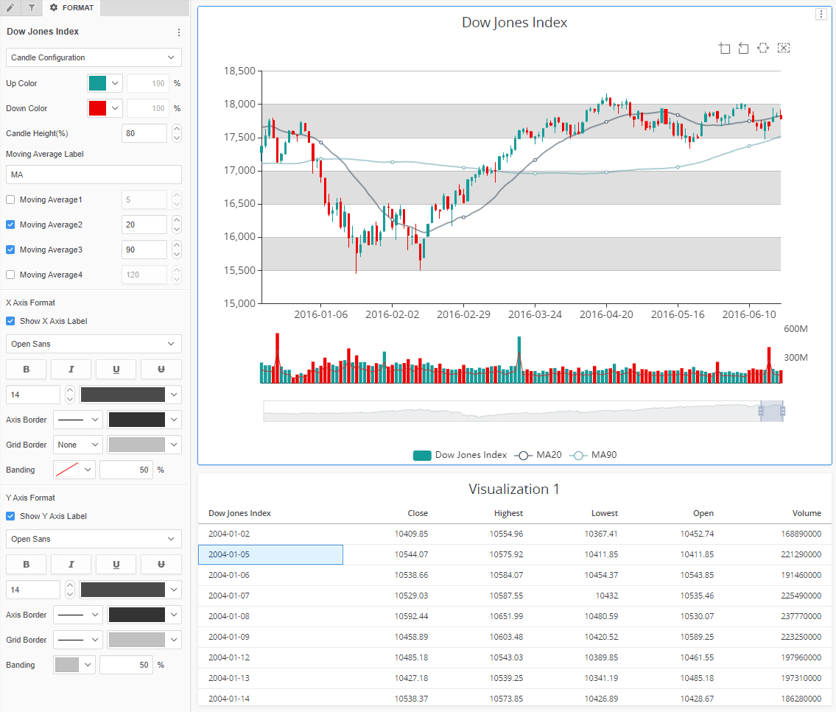
Candle Chart custom Visualization.
Visualize candle chart for stock price visualization.
This Visualization requires 1 date attribute and more than 4 metrics (Open Price , Close Price , Lowest Price , Highest Price , Volume , Trade amount)
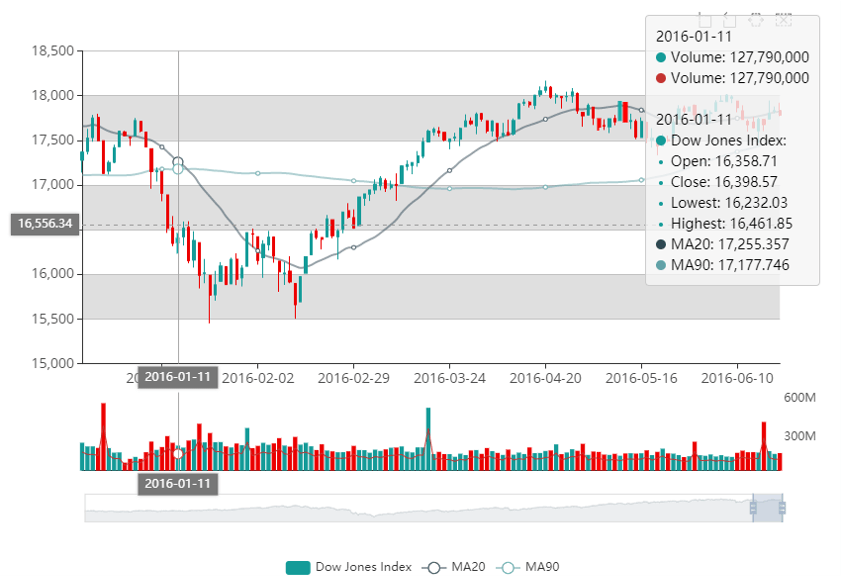
You can configure Up / Down color , fonts , grid border , banding background and 4 Moving Average line.
Watch a quick tutorial video on importing custom visualizations in Workstation.
Strategy Version
* Tested on version m2020 and m2019 (2019 version is not support target different page feature)
Strategy feature
* PDF Export
* Set Target Visualization
* Set Target Page & Dossier (Only on Web)
Publisher: DongHyub Lee (Sales Engineer in Strategy Korea)
Visualization Disclaimer
By downloading or using this visualization, you accept and acknowledge these terms.
This visualization is both intended as sample code and provided as a convenience to Strategy users. Strategy cannot guarantee that the code provided will apply to any Strategy releases and clients outside of the versions stated within this article. This sample is supported by Strategy Technical Support up to and including the basic visualization functionality listed in this article. Defects will be triaged by the Strategy team as they are raised. For users with active Strategy Technical Support contracts, contact Strategy Technical Support to raise these defects.