New Features & Functionality
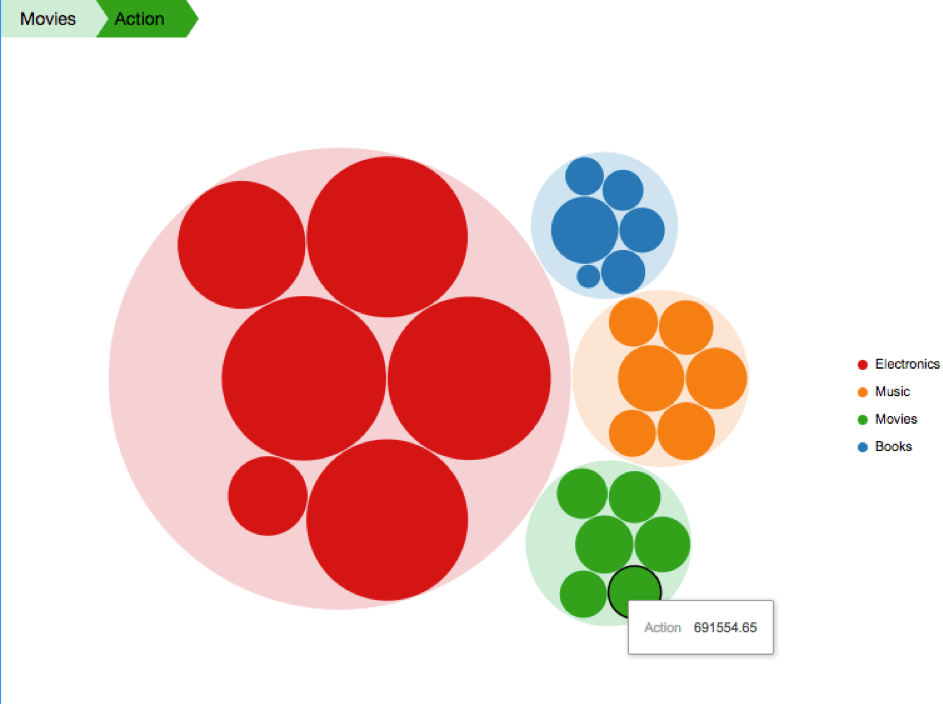
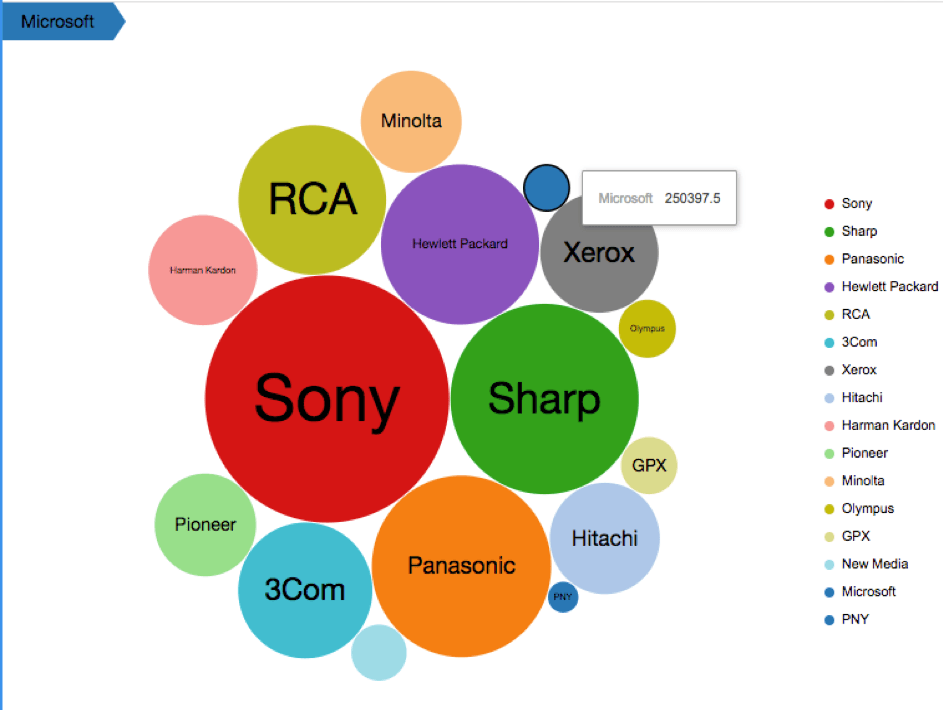
The Circular Tree Map
With Strategy, you will have a variety of different choices for visualizations. Many times, users choose custom visualizations. Visualize hierarchical data as nested circles of different sizes and colors, using the Circular Tree Map visualization. Each circle represents a level in the data hierarchy, with the color of the circle corresponding to an attribute and the size determined by a metric value. With this visualization, users can quickly and easily spot patterns for even large datasets - for example, identifying which store provides the most profit.
Visualization Features
Requirements
Object requirements:
Minimum Strategy Version: 10.4
Current visualization Version: 1.0
Publisher: Strategy
Strategy Features
Additional Features
Installation Instructions
To install this visualization:
After you have installed the visualization, you can open a working demo of this visualization by downloading the .mstr file below and doing the following:
Using the visualization in Strategy 10.4
This visualization is fully supported in Strategy 10.5 and higher, and partially supported in Strategy 10.4. To use this visualization in Strategy 10.4, you must remove the following lines of code from CircularTreeMap.js file.
(Remove lines 22 to 24):
noConflictLibraries: [
mstrmojo.CustomVisBase.ENUM_EXTERNAL_LIBS.D3
],
If these lines are not removed, they will cause a compilation error because this object is not defined in the 10.4 API.