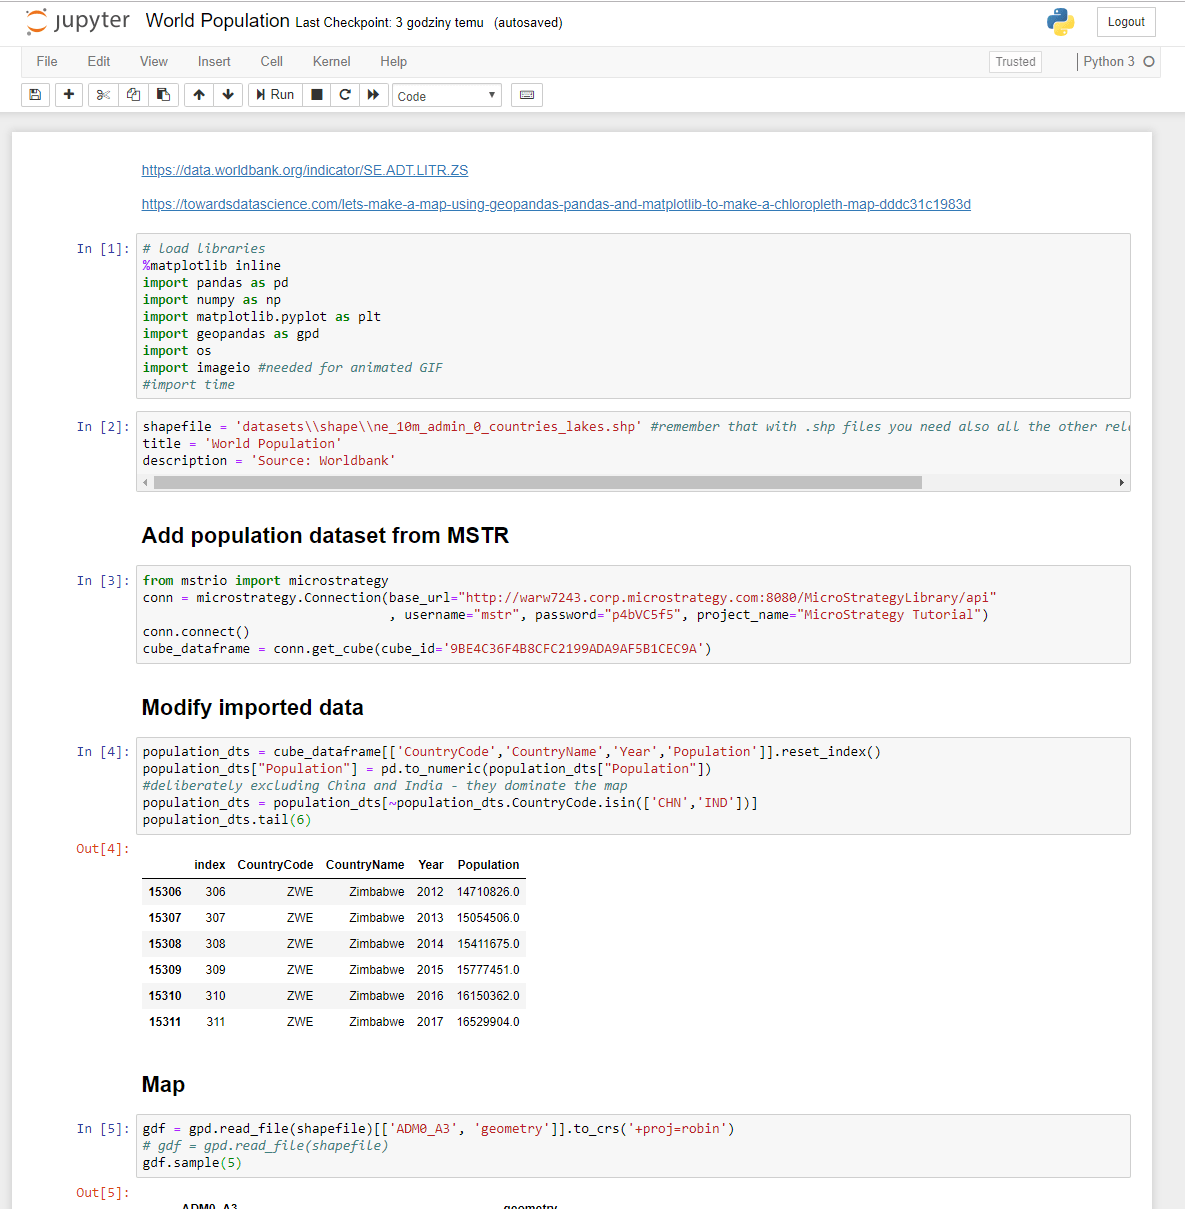
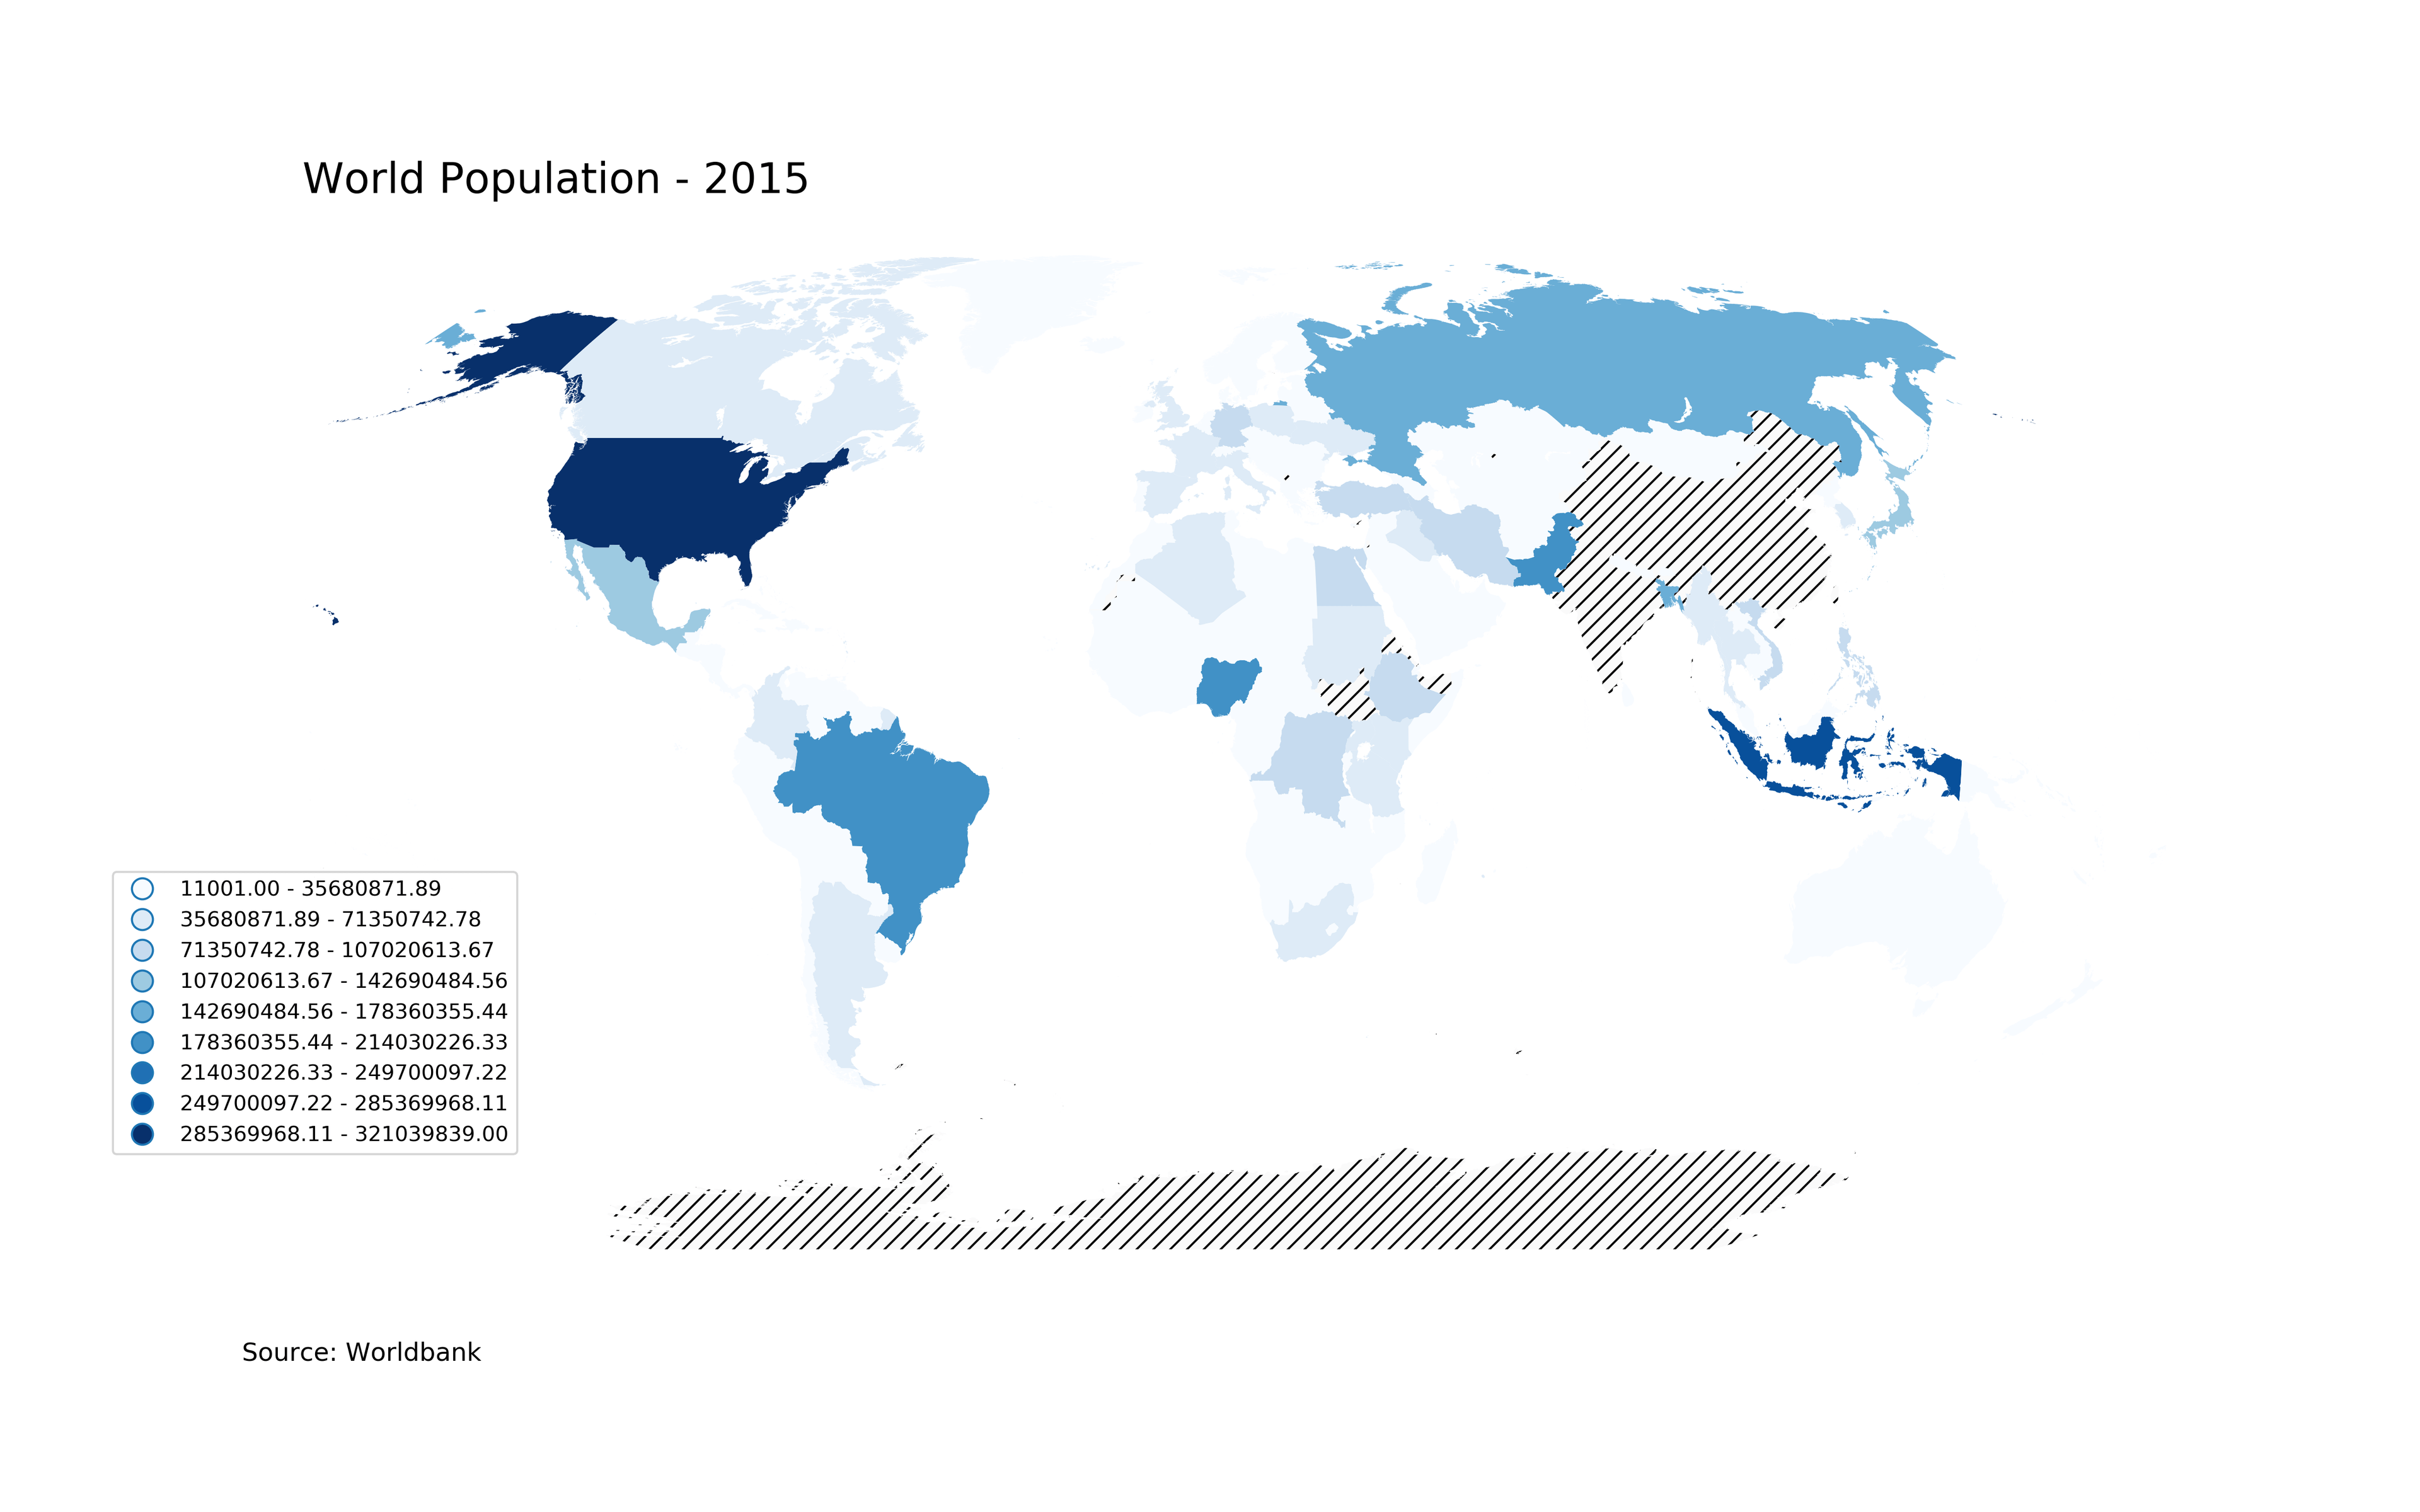
Python offers several libraries that help creating map visualizations. Using the code from this example, using mstrio library, one can produce several images with maps and save them to a folder with unique names. Later those maps can be added back to RS document by referencing their unique names.
Maps can be easily animated and, again, easily added back to RS document.
In attached zip file you will find:
- Jupyter notebook
- Python file
- excel file with statistics data
- shape file
- example of generated maps