Starting with the release of Strategy ONE (March 2024), dossiers are also known as dashboards.
Strategy Best Practices
Learn more about Clustered Bar Charts
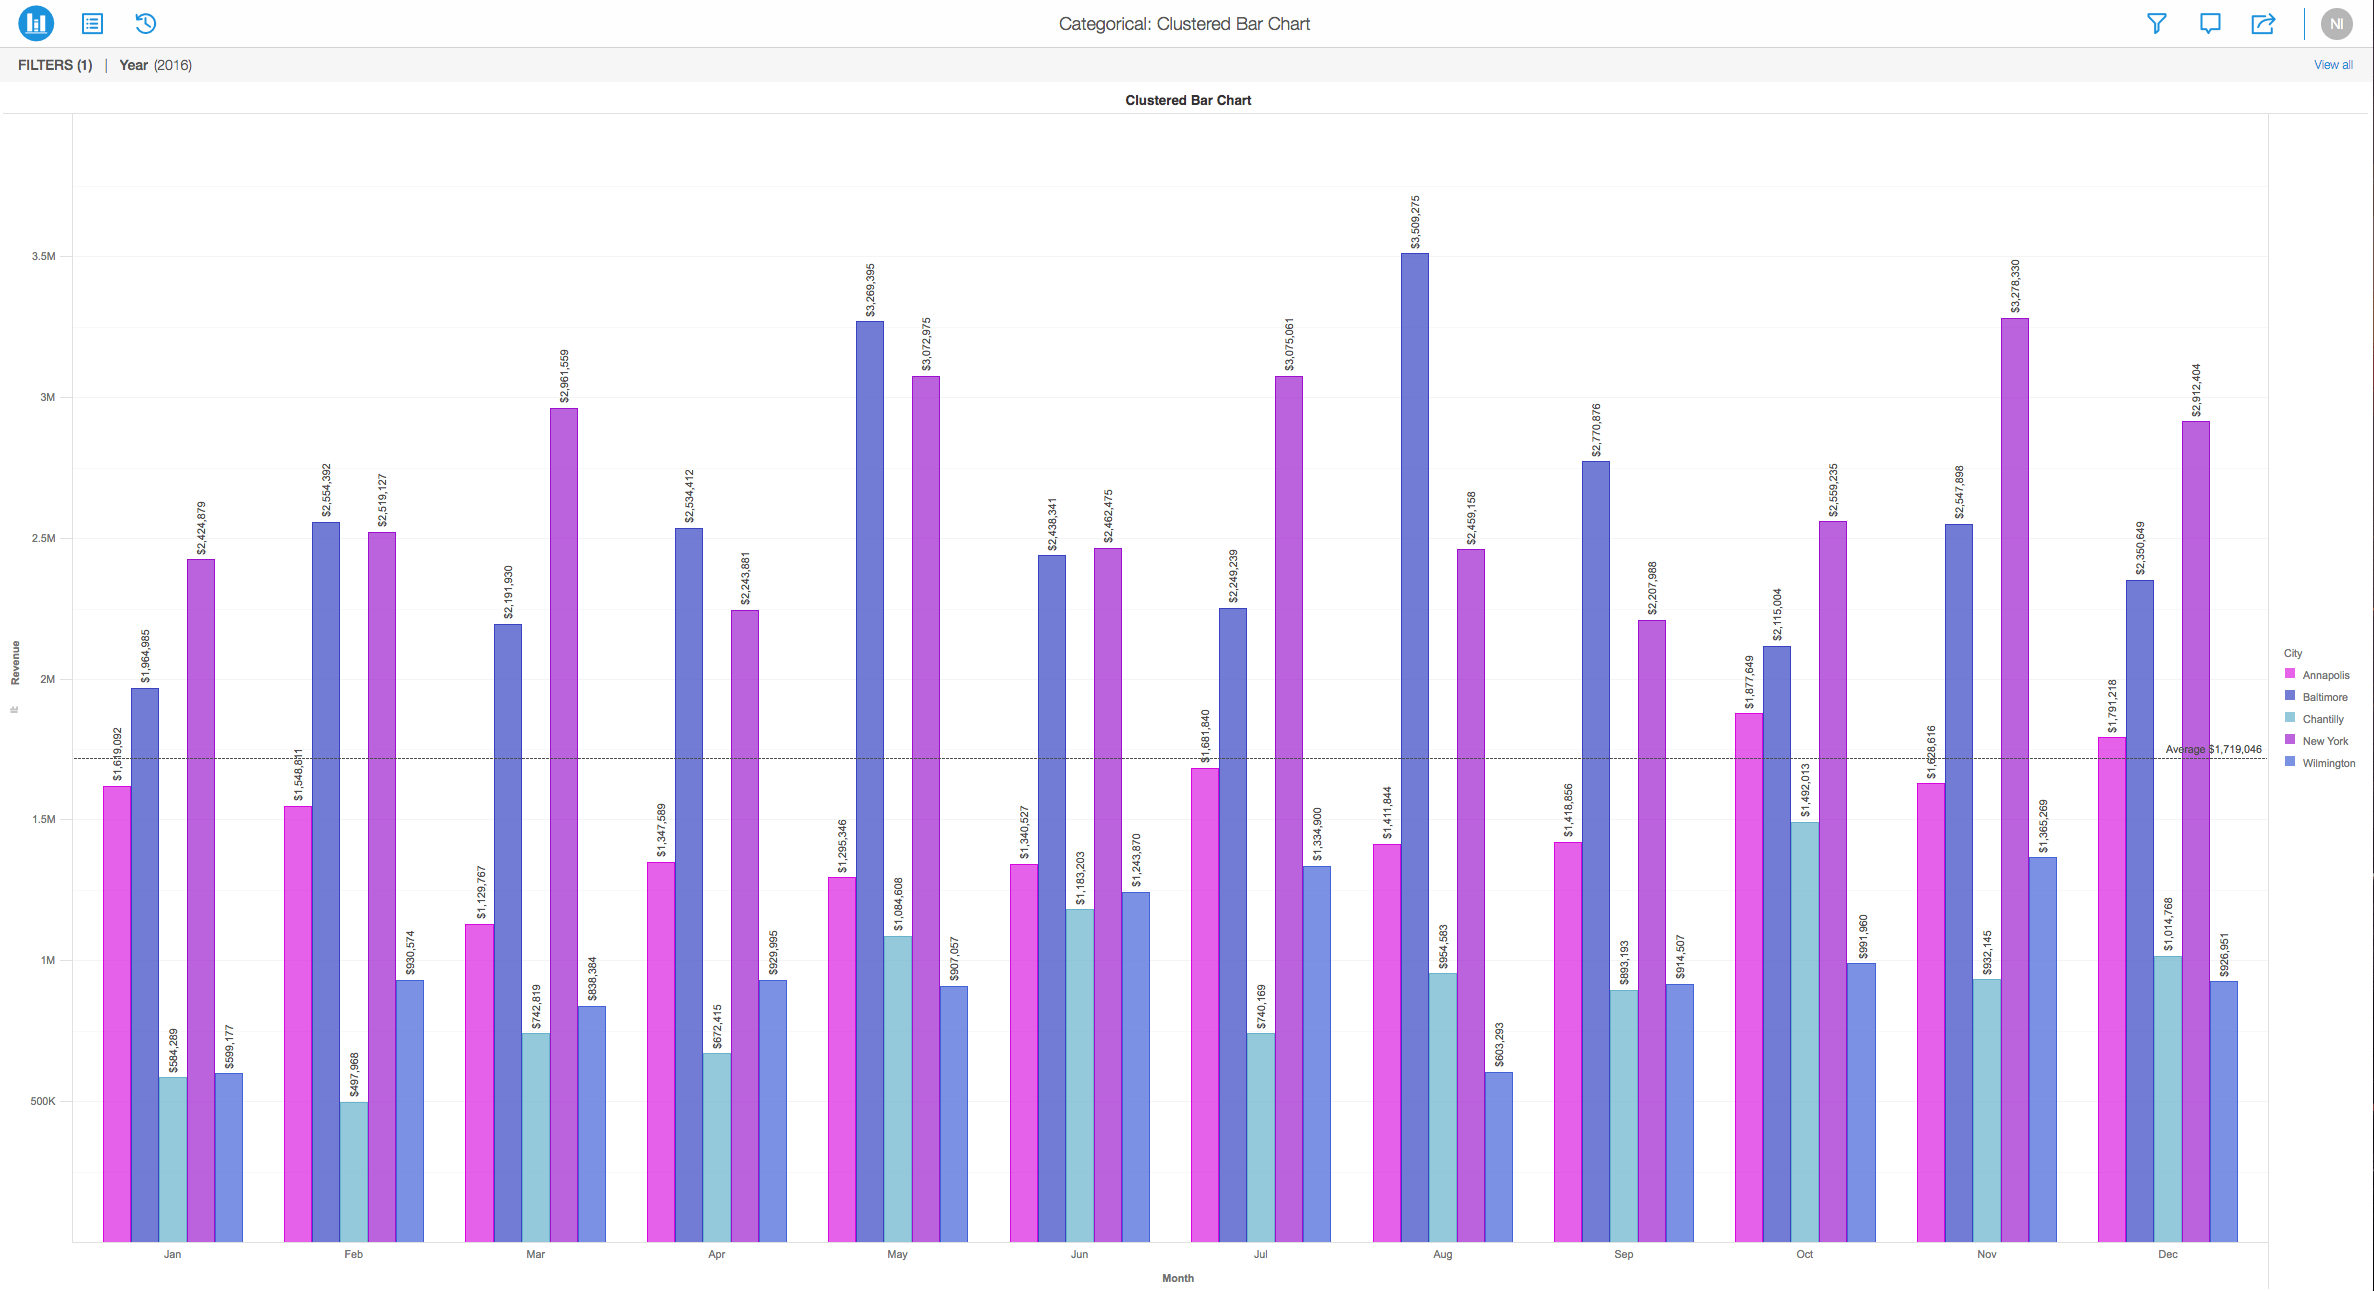
When bars of a different bar graph are placed next to each other and not stacked, it is a clustered bar chart. It shows more than one data series in a grouped fashion. These allow for a direct comparison of multiple series, but they can quickly become visually complex. Hence, they should be used for limited data point for a visually clear comparison.
One great example of when to use a clustered bar chart is to show change over time and allow direct comparison of multiple data series per category. This might show sales over the last three months of the year, or purchasing trend in total amount of a certain product sold. Clustered bar charts allow you to view comparisons on a larger scale.
In the photo below, imagine you have Sales on the Y-axis and different months of the year on the X-axis.
Requirements
Minimum Strategy version: 10.2
Publisher: Strategy
Installation Instructions
To view this dossier with the visualization, download the .zip file below and deploy it in Strategy Desktop or Strategy Web. You can open a working demo by uploading the .mstr file below and doing the following:
Start your analysis using bar charts by downloading MicroStrategy Desktop now!
Start Creating Bar Charts
References
A project in beta by ferdio, (2017, December 4th). Retrieved from https://datavizproject.com/