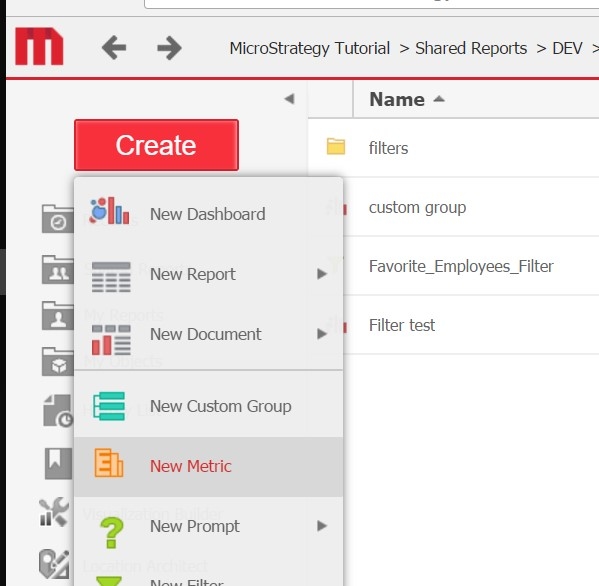
Starting with the release of Strategy ONE (March 2024), dossiers are also known as dashboards.
Conditional Metrics (with filters) in Dossier
The Scenario
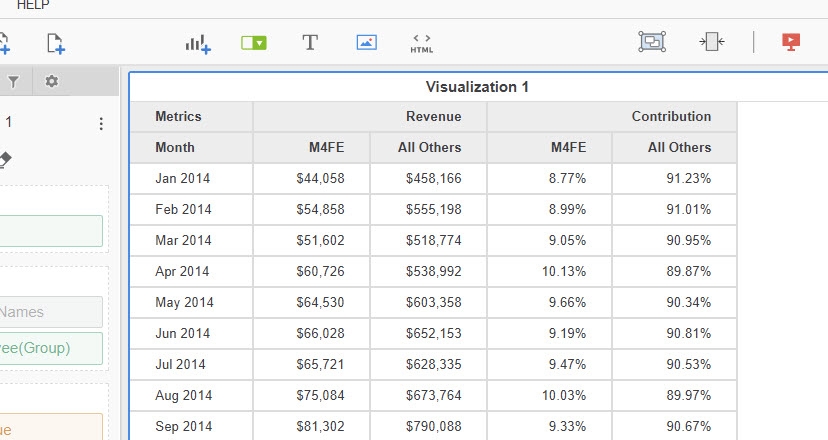
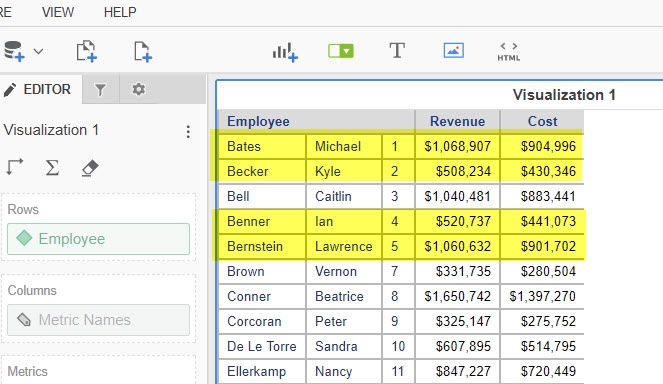
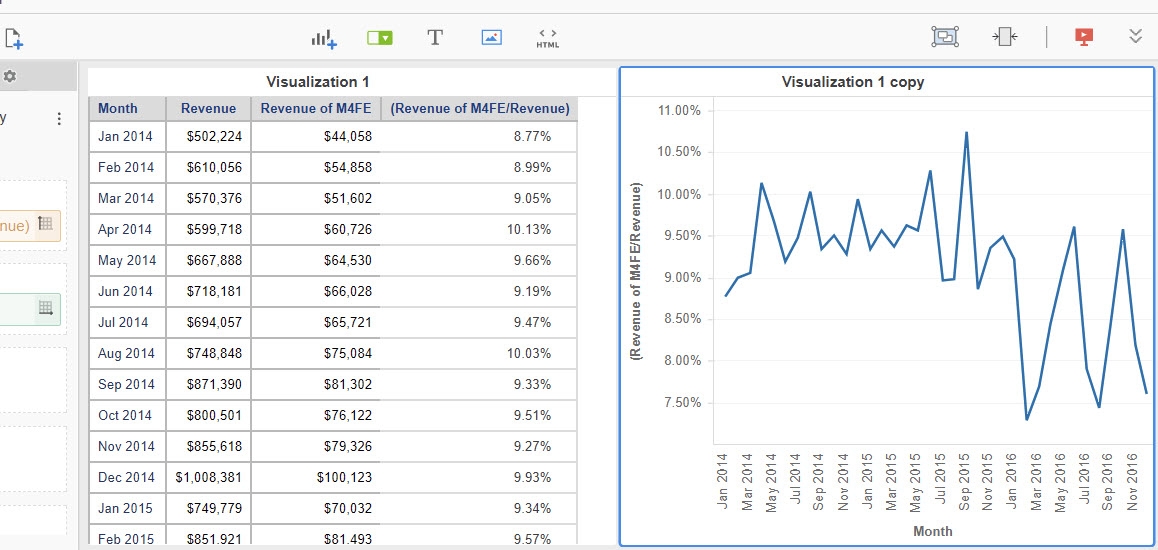
There’s a Revenue report with breakdown on Employees. I want to hand-pick a custom list of people (in my case four highlighted employees) – let’s call them "M4FE" (My 4 Favorite Employees). I want to calculate a total of those four and then calculate the percent contribution of M4FE to the total result of the whole company. Then I want to display this contribution as a monthly trend.
I could use derived elements and grouping to quickly calculate this number. However, for this exercise I focus on conditional metrics, since they can be more powerful and can be reused in other calculations. See the last part for information how to use grouping for that purpose.
So, we need to embed a condition into the metric formula. That’s possible in several ways. The method you should choose depends on the answers to those questions:
What's the Expected Outcome?
Methods that can be applied
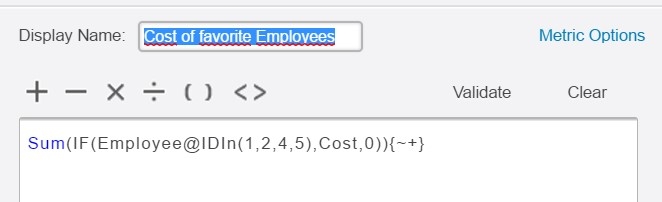
1. Metric with an IF Function
Metric definition:
Sum (IF(Employee@ID In (1,2,4,5),Revenue,0)){~+}
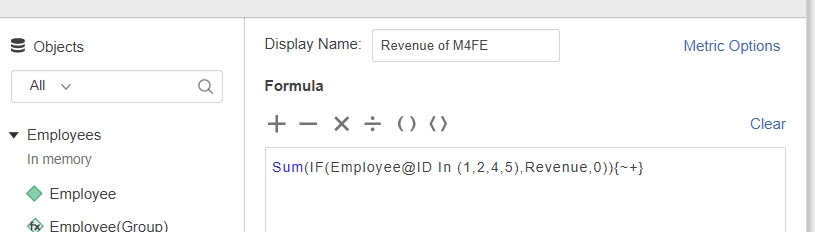
This is good as a quick solution, since each metric will have its own copy of the filter in the IF function. When you want to add to or remove something from the list you need to repeat that separately for each metric, which means increased maintenance efforts.
Below is the formula and "filter" repeated for the "M4FE Cost" metric.
2. Flag Metric
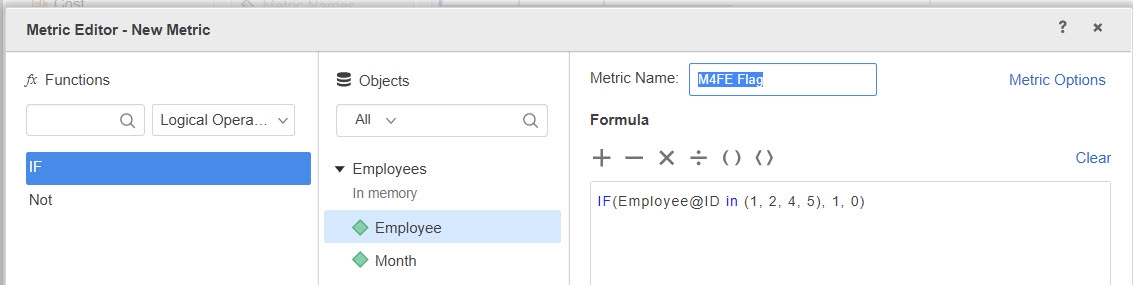
M4FE Flag metric works here as a filter.
IF (Employee@ID In (1, 2, 4, 5), 1, 0)
In case you need to change the list, you need to do it only once. All other metrics using the M4FE Flag will be automatically updated.
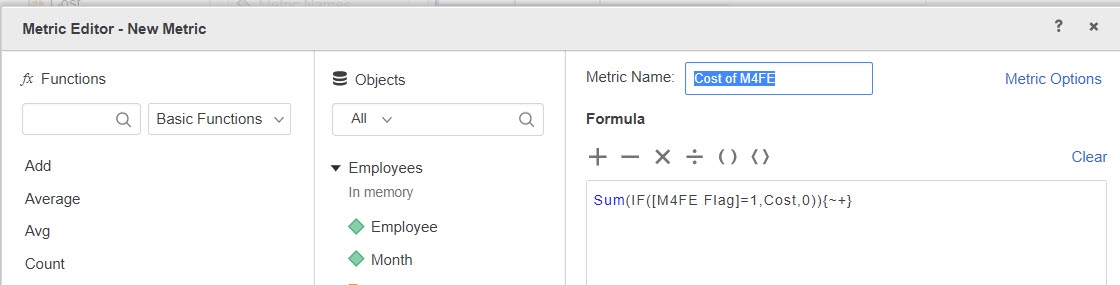
Here is a new definition of M4FE Cost.
Sum (IF([M4FE Flag]=1,Cost,0)){~+}
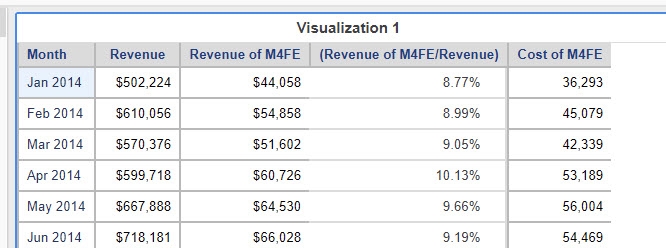
Report
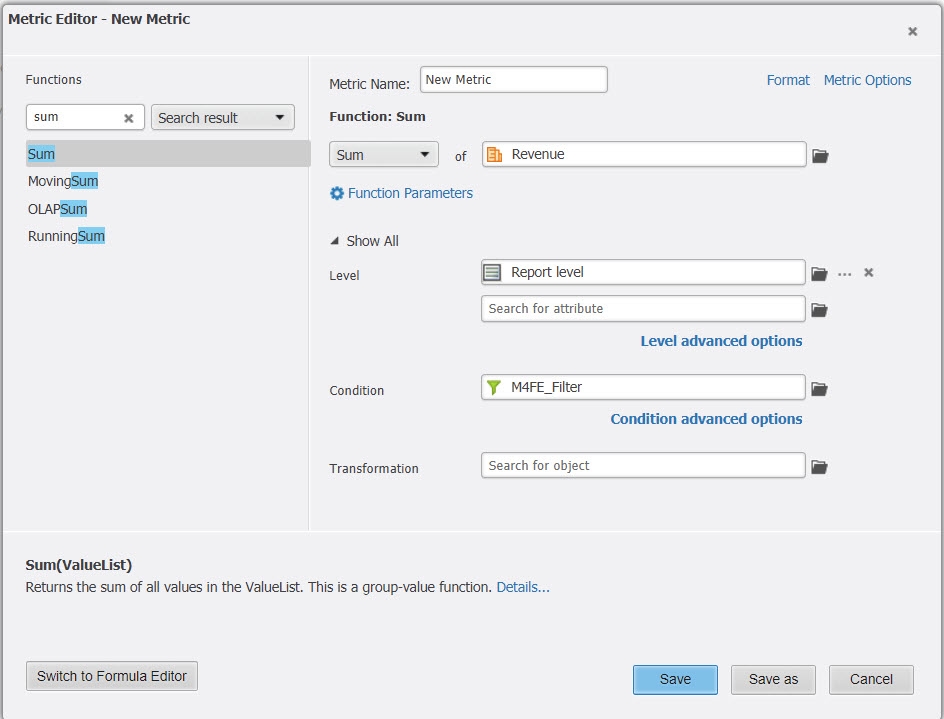
3. Standalone Filter Object
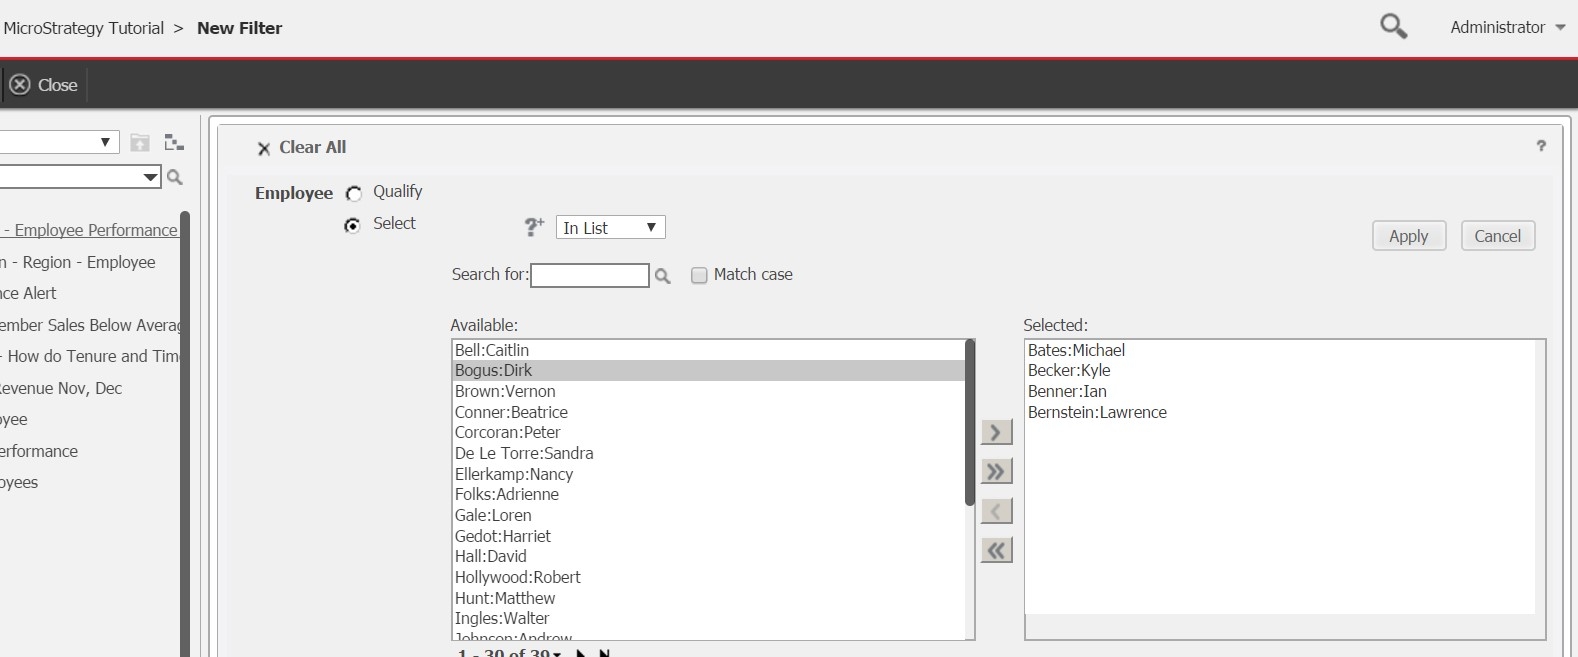
Filters can only be created out of schema attributes (in this case: Employee). It means this scenario cannot be applied if your data is imported from Web. Create a Filter object and save it in an accessible location.
In a dashboard, create a metric with this formula:
Sum (Revenue){~+}<Favorite_Employees_Filter>
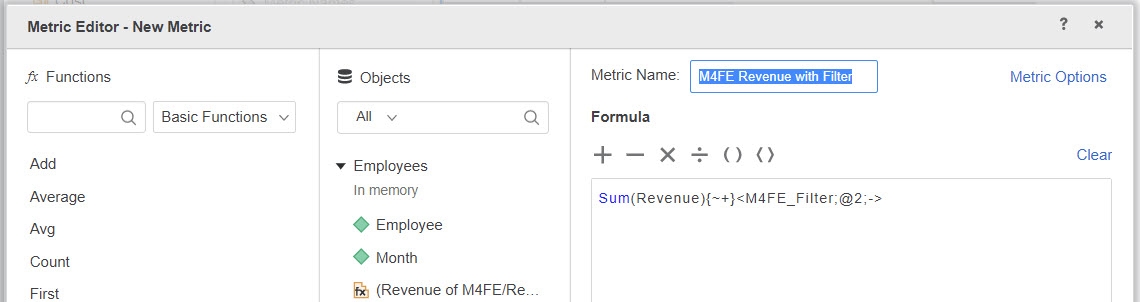
Important note
Create this formula Sum (Revenue){~+} first, as usual. Then, type the name of your filter in angle brackets (<>) and click "Validate." Adding a filter as a condition is an undocumented feature, so typing it manually is necessary.
If everything is OK you will get a green "Validated" sign.
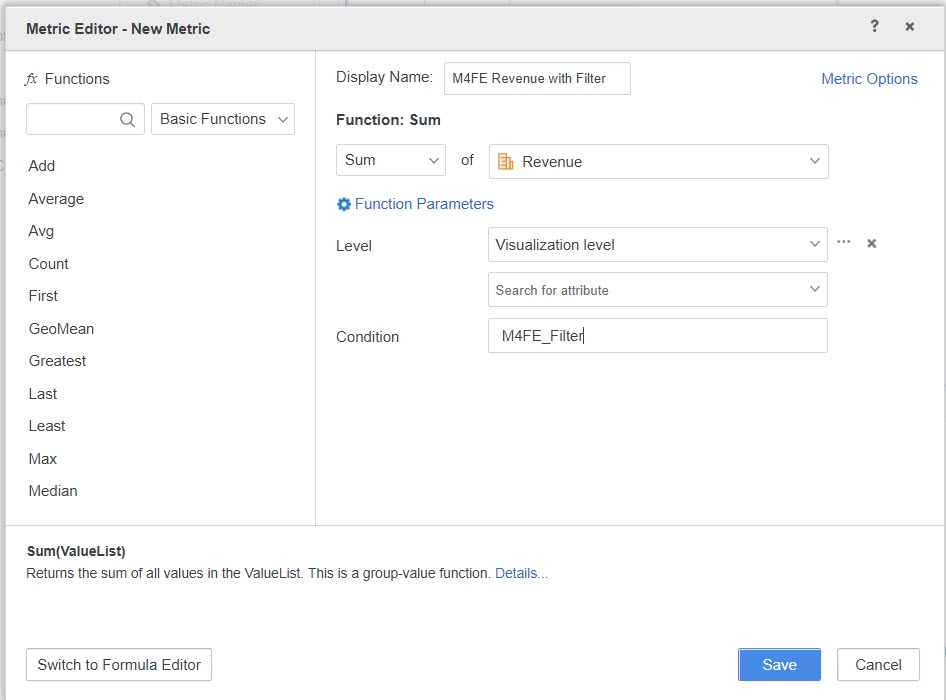
When you switch to the Function Editor, you will notice a new field called "Condition", which wasn’t visible before.
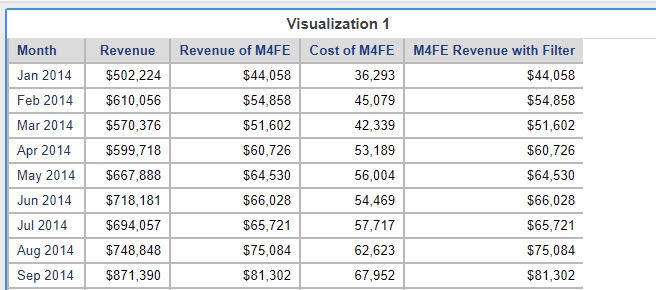
Report
Alternatively, instead of creating conditional metrics inside a dashboard, you can create them as standalone objects in the folder structure. See the image below for an example.
This editor contains the "Condition" field by default, so you are able to select your filter normally from the list.
4. Grouping
Multi-select elements and define a group.
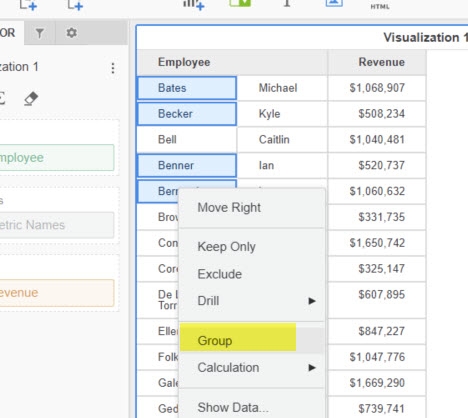
Use the shortcut metric to calculate contribution to Total by Rows.
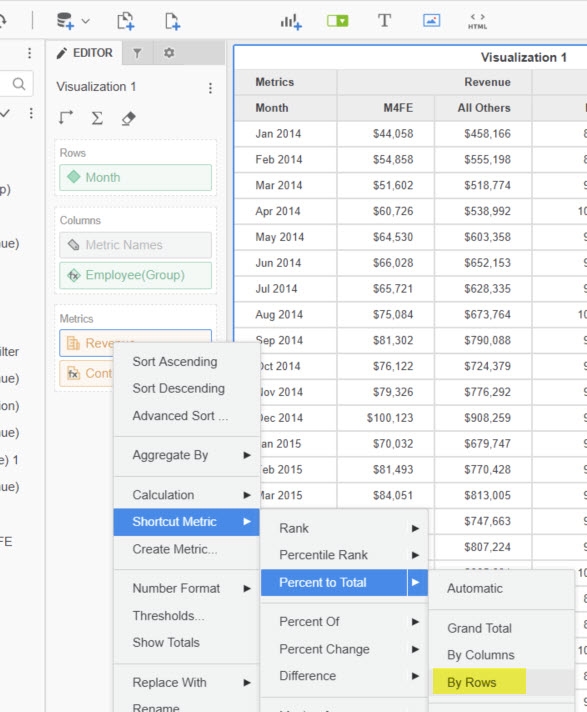
Edit the group and change display of "All Others" (one consolidated group).
Final Report
If you've been following along, the final report you've designed should appear something like this!