Starting with the release of Strategy ONE (March 2024), dossiers are also known as dashboards.
As Strategy and ESRI continue to make improvements to the service/API's, ESRI keys provided for older versions of Strategy may stop working. Please ensure that you stay on the latest supported release of Strategy to avoid interruptions in service. In particular, ESRI keys provided for Strategy 2021 Update 4 and earlier will cease to operate in April/May 2024.
ESRI Map is a visualization integrating geo services into Strategy dossier. It allows to deploy dynamic maps and perform rich analysis on geographic level. Integrating map-based query capabilities allows to filter data and spot trends and patterns.
The most important thing in deploying ESRI maps in Strategy is properly prepared dataset. The main requirement is to have at least one Geo Attribute. It is an attribute with defined geography - this can be done during data preparation while adding datasets. It is essential for the visualization to show proper data.
There can be many types of Geo Attributes, such as:
To show data valuable for any analysis, the map visualization requires at least one Attribute (including Geo Attribute) and at least one Metric.


ESRI Map allows user to chose one of 7 styles of the map:

To change the style, go to Format tab → Visualization Options → Map Layout → Map Style. Or, alternatively, go to the map itself and select the Styles dropdown located above the map.
After adding Geo Attribute, data points will be by default set to Markers in the shape of Pins. To change that, go to Format → Visualization Options → Data Points → Type.
This is a default setting of the Geo Attribute after adding it to the visualization. They can be shaped as:


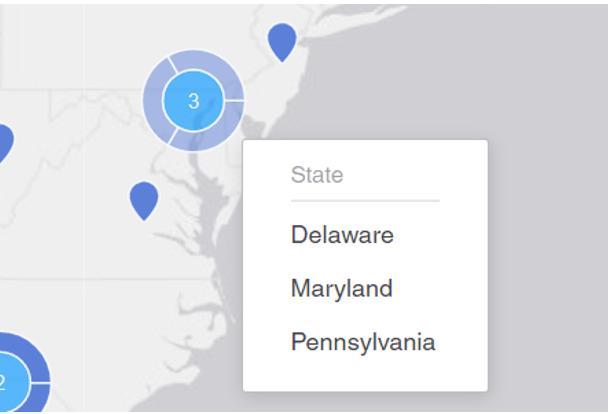
When there is a high density of data, there is an option for clustering – data point will show up as one circle with an information of the number of points clustered. There is also the possibility of showing details in a ring. To enable those options, select Enable clustering and Show details in ring under Data Points.
The second type of Markers available on ESRI Map. The advantage of Bubble Type Data Points is that it can be sized and coloured by metrics, for example, Sales.
To do that, go to Editor tab and drag and drop a metric to the Size By/Color By section. Bubbles can also be clustered like Markers.

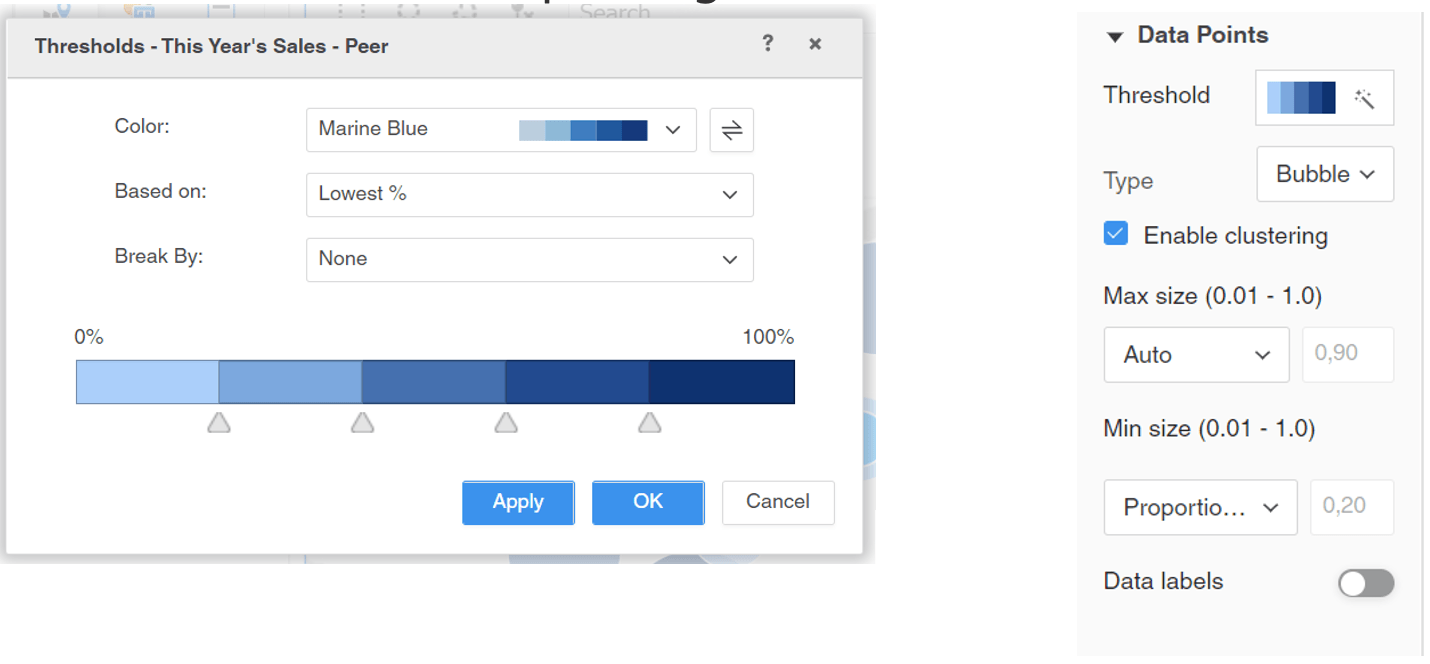
Adding metric to Size By/Color By section, will enable more options in the Data Point section, such as Threshold, Max size and Min size. The sizing allows to change maximum and minimum size of bubbles. Threshold option is meant to colour data depending on the metric’s value:
After selecting Area type, the visualization will automatically detect Boundaries. To change that, select Boundaries and choose a proper one. Area type also allows to add threshold based on the metric.

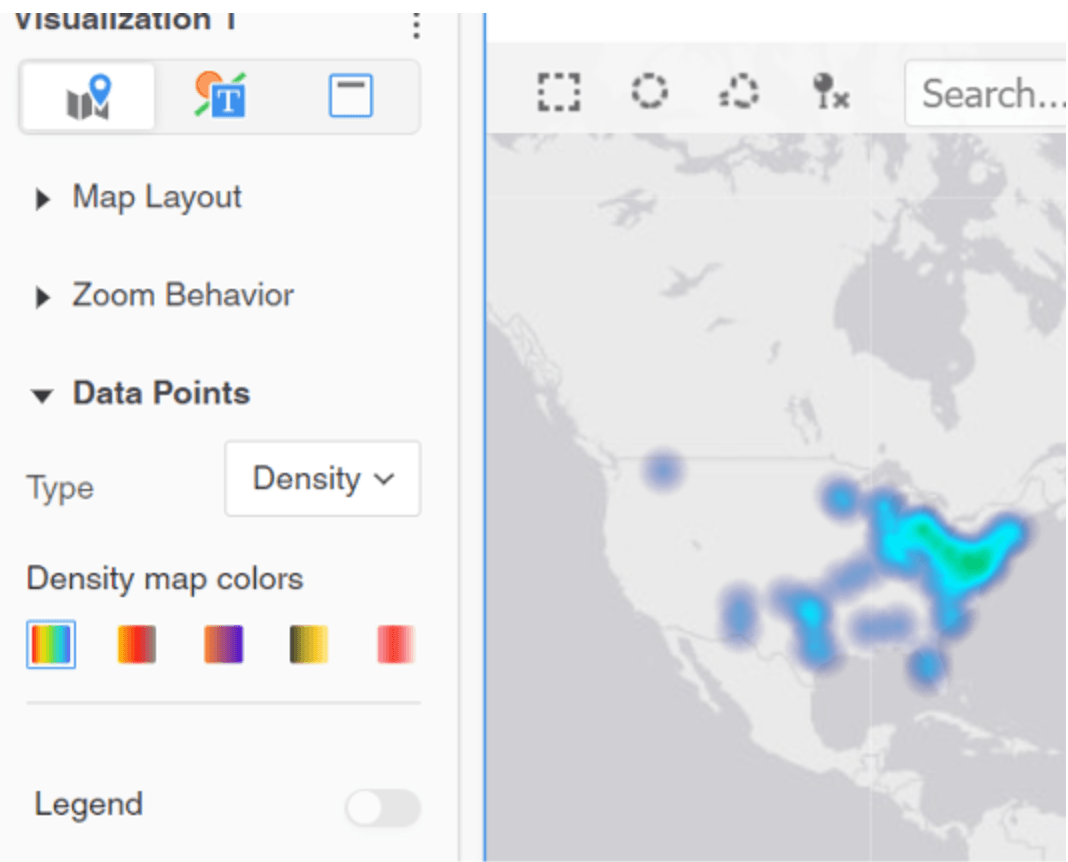
Locations can be displayed in a map visualization using a density type. Density maps allows to visualize patterns and trends for several geographic locations by using color gradients based on the concentration of geographic data.
Adding Layers
ESRI Map allows to present data for more than one Geo Attribute - to do this, it is necessary to add layers to the visualization. Go to Editor tab → Layers → Add Layer. After that, introduce second Geo Attribute to the visualization.

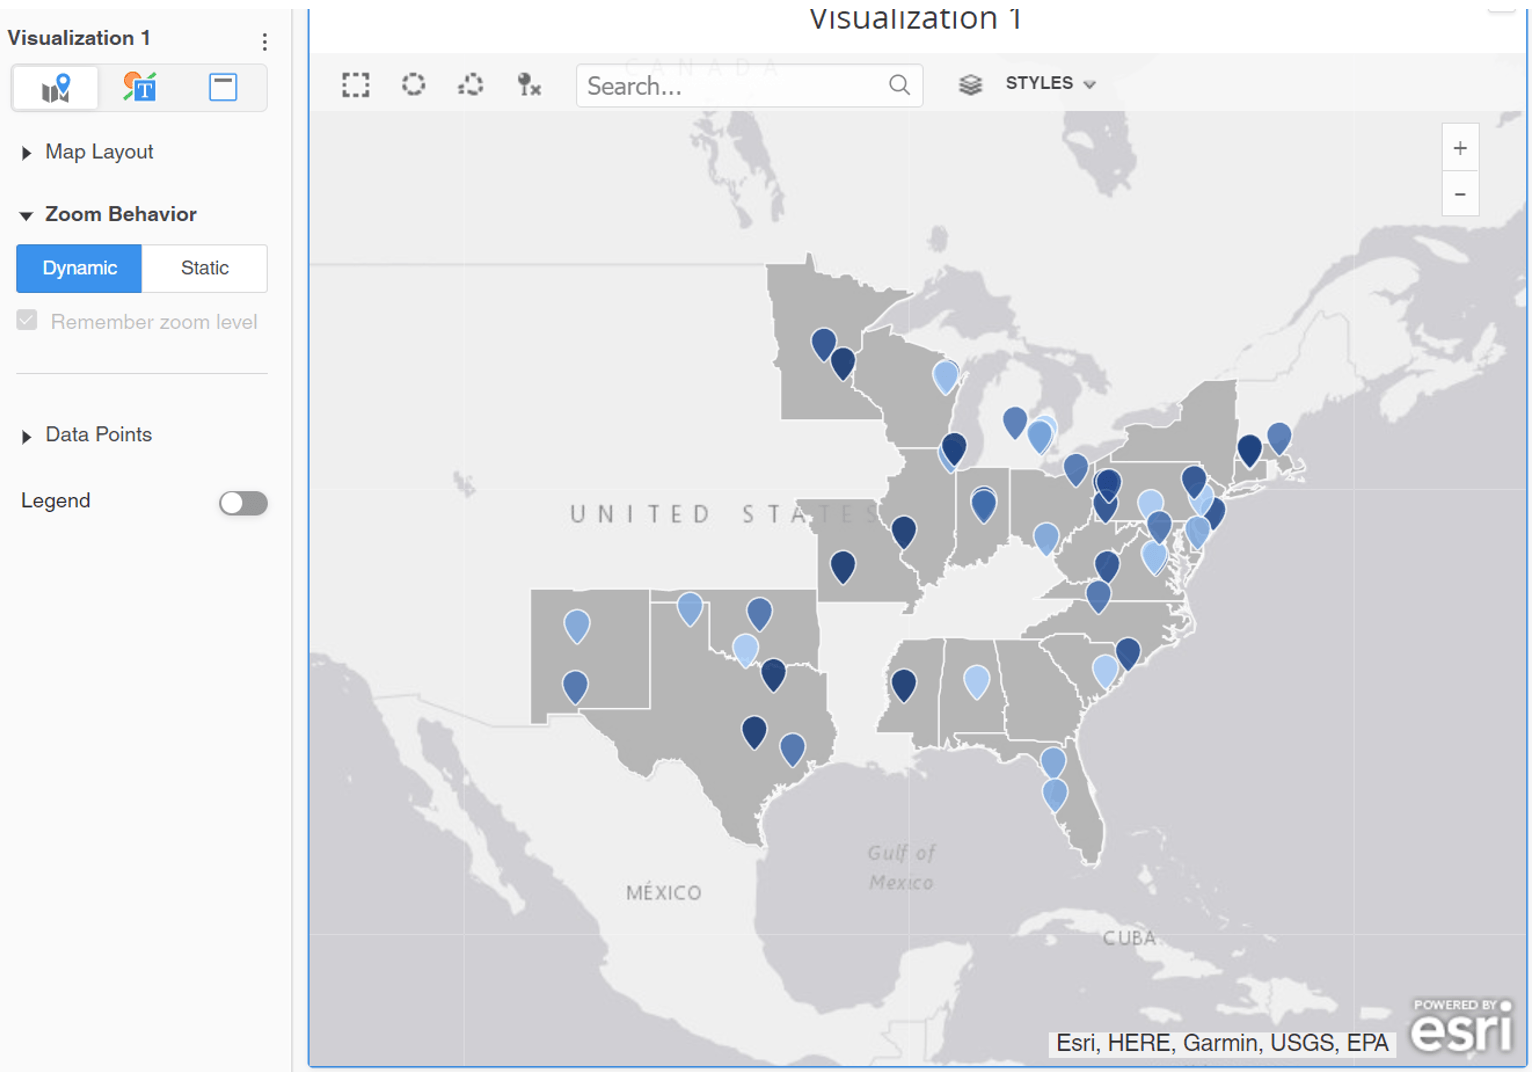
By default, the map will zoom out to show all available geographical data. This setting is called Dynamic zoom. In order to fix the view on a specific area, go to Format tab → Zoom Behavior → Static → Remember zoom level.

As mentioned earlier, adding metric to the Color By section enables to threshold data on the metric’s value. There are 3 ways of configuring thresholds:
The threshold can be selected from list of built-in colors or configured manually. There is an option to break by attribute or to change on what the threshold is based on:

