EducationSoftwareStrategy.com
StrategyCommunity

Knowledge Base

Product

Community

Knowledge Base

TopicsBrowse ArticlesDeveloper Zone

Product

Download SoftwareProduct DocumentationSecurity Hub

Education

Tutorial VideosSolution GalleryEducation courses

Community

GuidelinesGrandmastersEvents
x_social-icon_white.svglinkedin_social-icon_white.svg
Strategy logoCommunity

© Strategy Inc. All Rights Reserved.

LegalTerms of UsePrivacy Policy
  1. Home
  2. Topics

KB485388: Creating Running Sum Metric on reports with Custom Groups


Andre Moolman

Senior Consultant • MicroStrategy


This article describes creating Running Sum Metric on reports with Custom Groups.

Starting with the release of Strategy ONE (March 2024), dossiers are also known as dashboards.

Summary


When you create a Running Sum metric in Developer and you want to use it on a report with Custom Groups, the values are not calculated correctly.  In Developer, when creating a Running Sum metric, you can only select from existing objects, to specify the Break By and Sort By parameters.  
When you use the Running Sum metric with an existing attribute for example, it calculates correctly.  The problem comes in when you want to use a custom group on your report – you cannot choose a custom group in the Break By parameter.  From within a dossier however, you can create a Running Sum metric and have more options available when selecting the Break By and Sort By parameters. (Rows, Columns, Cell, etc.).  These options allow for correct calculation of running sums when using a custom group.
Typical use cases would be when creating a financial statement, like a balance sheet which uses custom groups to display the various general ledger items in the correct groups.  In this article, I will use a different example for illustration and also provide a workaround to get it working in Developer.

  1. From the Tutorial Project, I have created a simple report in Developer with Subcategory in the rows, and Month, Units Received and a custom Running Sum metric in the columns.  The Running Sum is defined as follows:

RunningSum<BreakBy={Subcategory}, SortBy= (Month) >([Units Received]) 
and should be the sum of the Units Received + Running Sum.
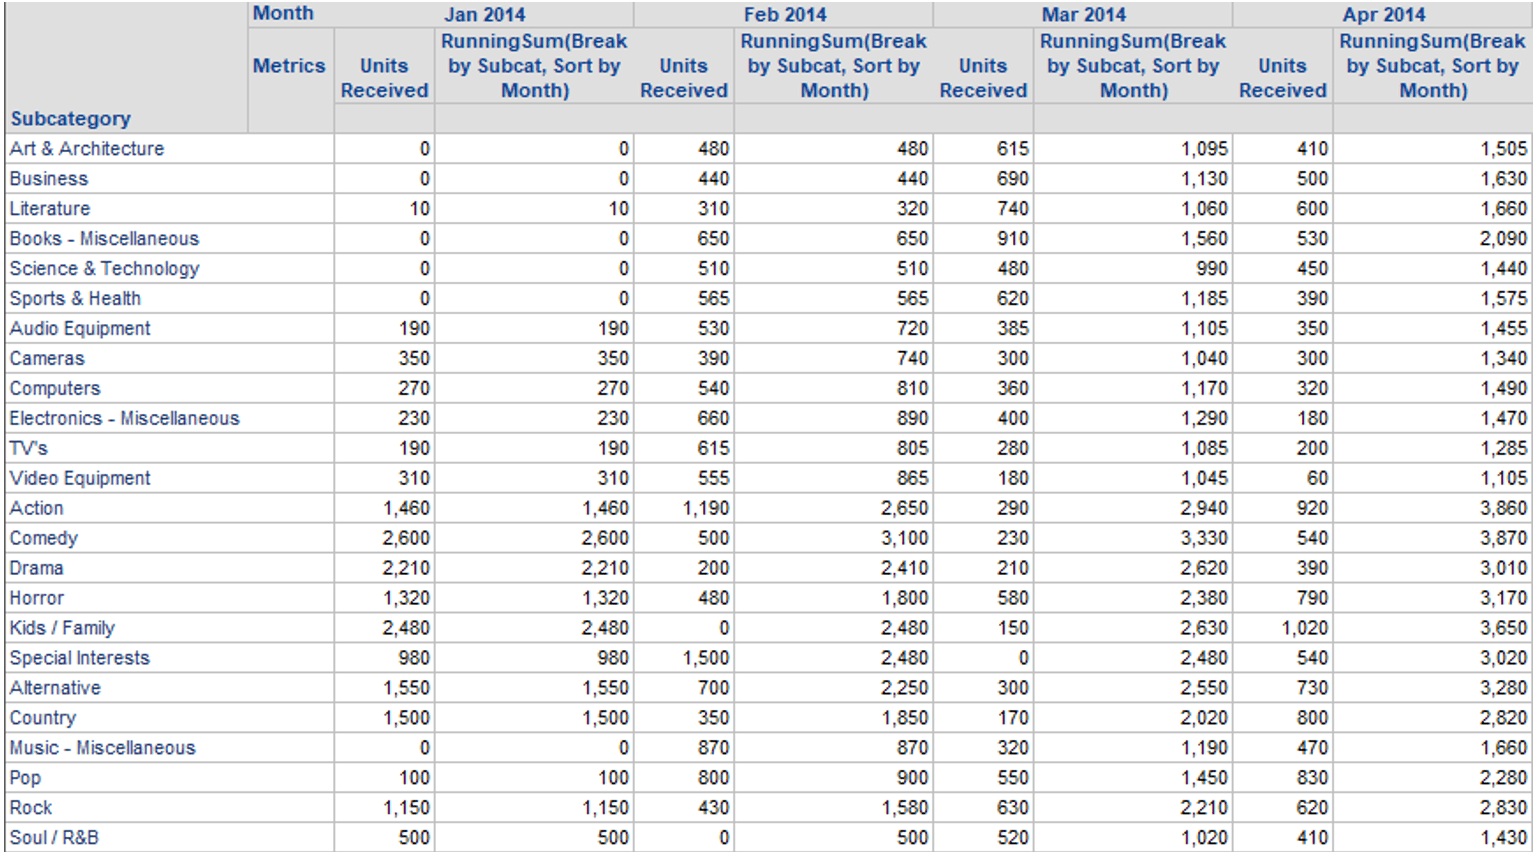
 

  1. The report is showing the correct results:
ka0PW0000001JhFYAU_0EM4W000004YTQw.jpeg


  1. Next, I created a Custom Group as follows:
ka0PW0000001JhFYAU_0EM4W000004YTR6.jpeg

Now, add this custom group to the report and remove the Subcategory.  The running sum is now completely inflated:
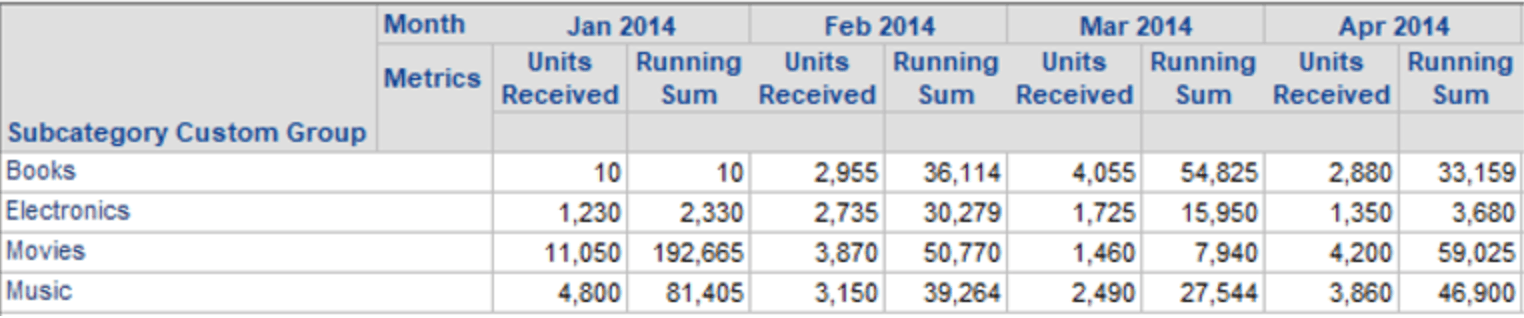
ka0PW0000001JhFYAU_0EM4W000004YTRB.jpeg


Workaround:

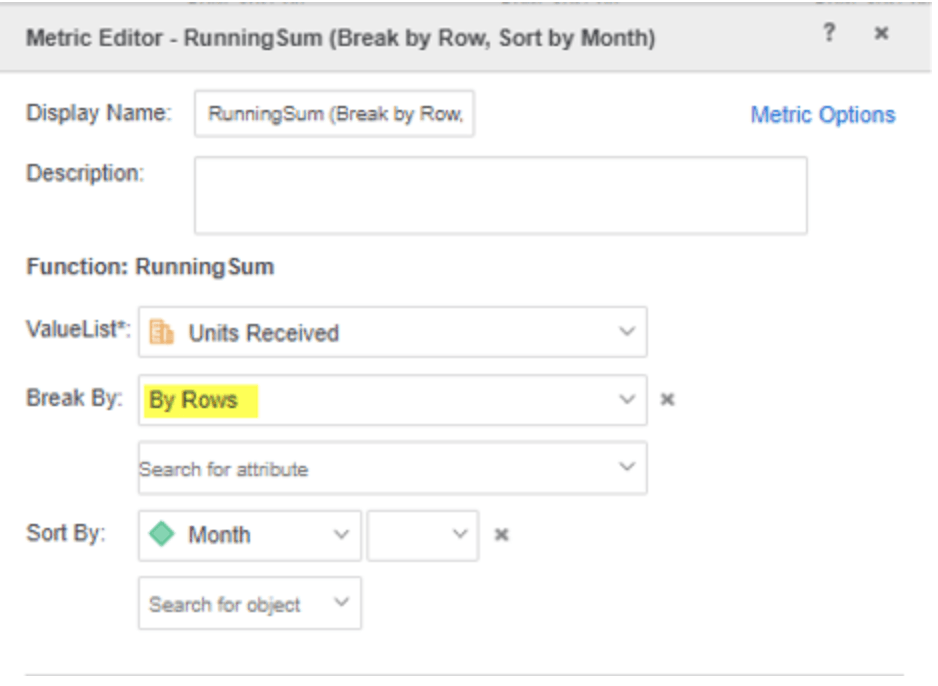
  1. Add the dataset created in the previous section, to a dossier and in the dossier, you create a custom metric, selecting By Rows in the Break By drop-down as follows:
ka0PW0000001JhFYAU_0EM4W000004YTRG.jpeg
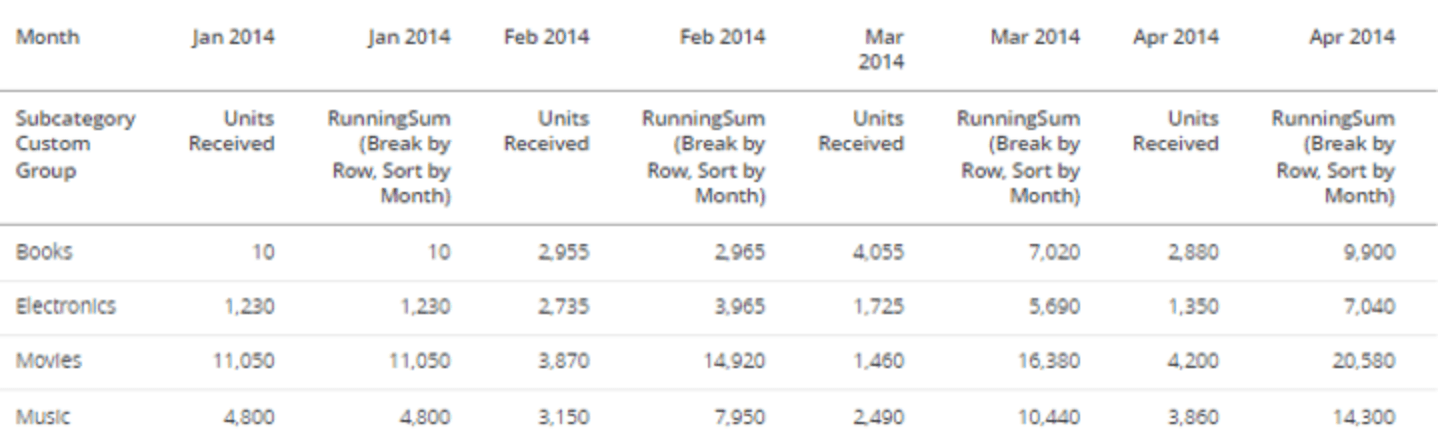
  1. Add this metric to the grid visualization in dossier, together with the custom group.  The totals are now calculated correctly across the different months.
ka0PW0000001JhFYAU_0EM4W000004YTRQ.jpeg
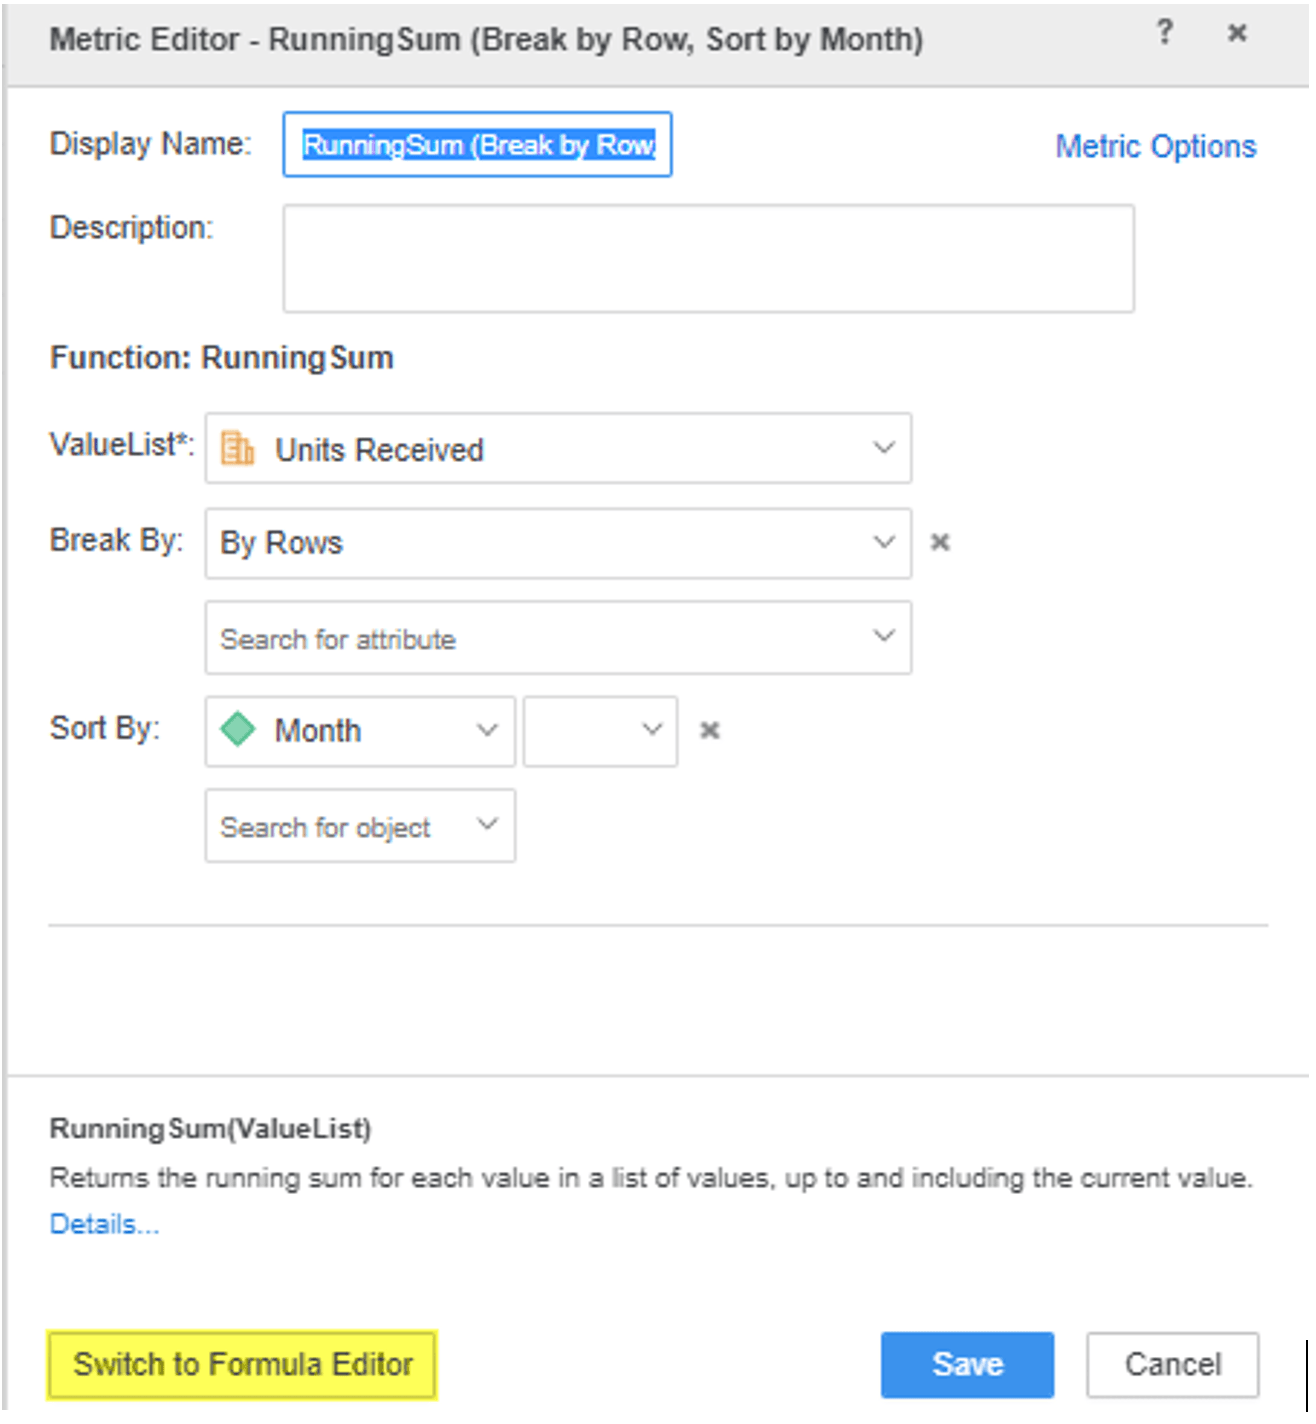
  1. To get this same result in Developer, edit the Running Sum metric that was created in Dossier, and select Switch to Formula Editor:
ka0PW0000001JhFYAU_0EM4W000004YTSi.jpeg
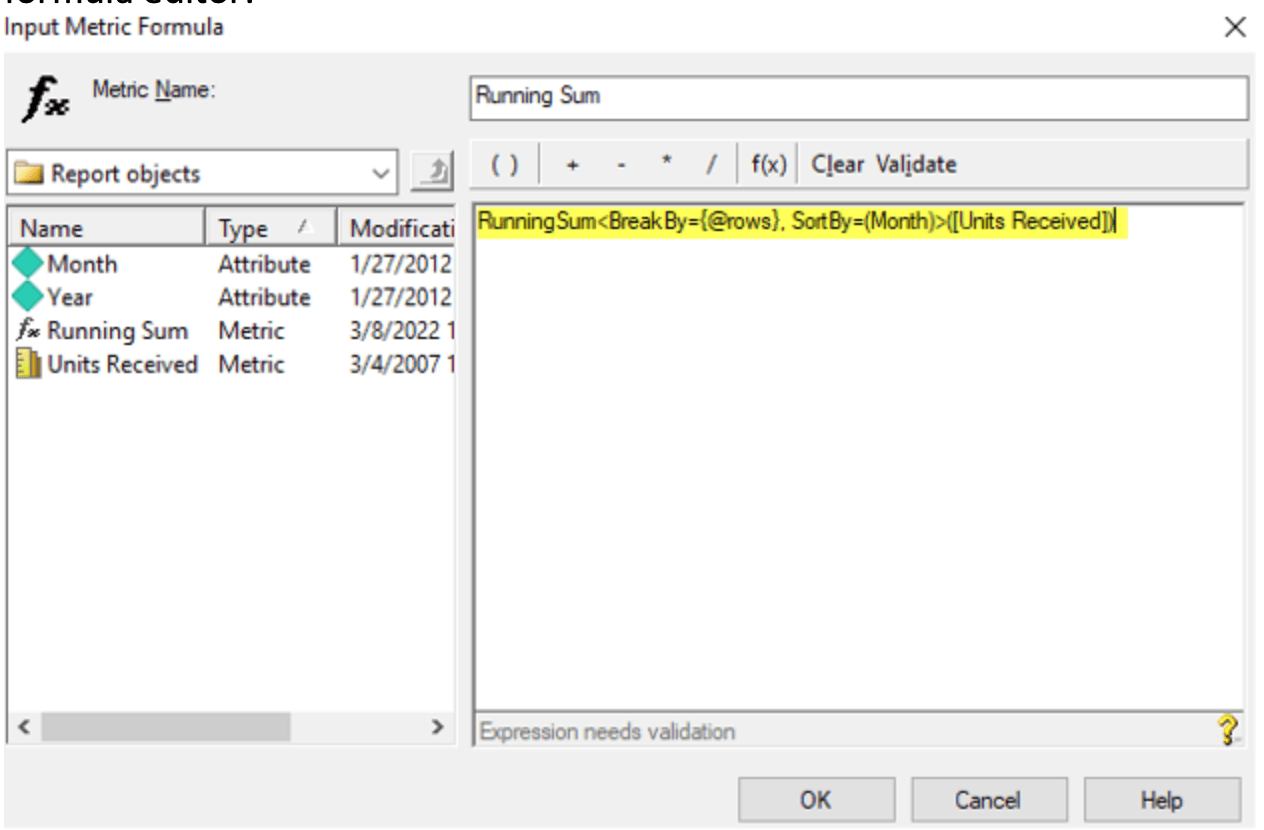
  1. In the Formula Editor window, copy the formula to the clipboard. 
ka0PW0000001JhFYAU_0EM4W000004YTRf.jpeg
  1. In Developer, create a new metric and paste the formula on your clipboard into the formula editor:
ka0PW0000001JhFYAU_0EM4W000004YTRk.jpeg
  1. Add this metric on the report with the custom group and note that the calculations are now correct:
ka0PW0000001JhFYAU_0EM4W000004YTRu.jpeg


Comment

0 comments

Details

Knowledge Article

Published:

March 8, 2022

Last Updated:

March 21, 2024