Starting with the release of Strategy ONE (March 2024), dossiers are also known as dashboards.
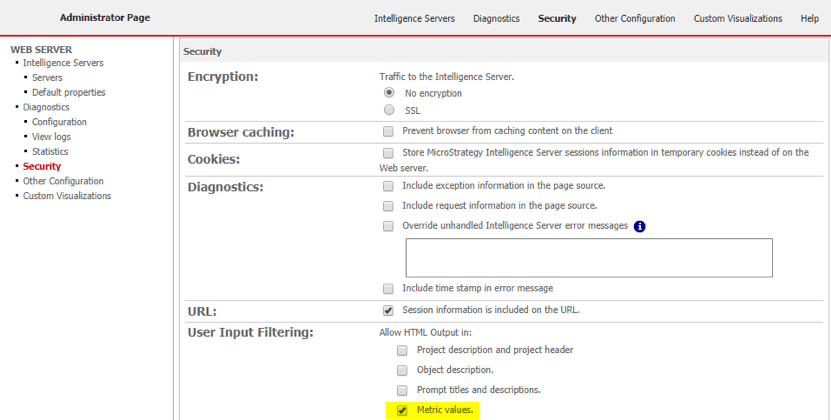
The following solution is based on HTML metrics, to properly render HTML Tag in Documents, “Metric values” needs to be checked under Administrator Page > Security > User Input Filtering. For use in Dossiers no prior steps are required.
Strategy allows to render HTML Tags inside metrics. This feature allows to significantly extend capabilities of the MSTR grids. For the purposes of this solution we will use HTML SVG tags to render graphics inside MSTR Metric. Please find attached “Bullet Chart Example_first.mstr” for a working POC and presentation of discussed features.
SVG stands for Scalable Vector Graphics. Usually this format is used for icons or simple images. SVG’s have general advantages of:
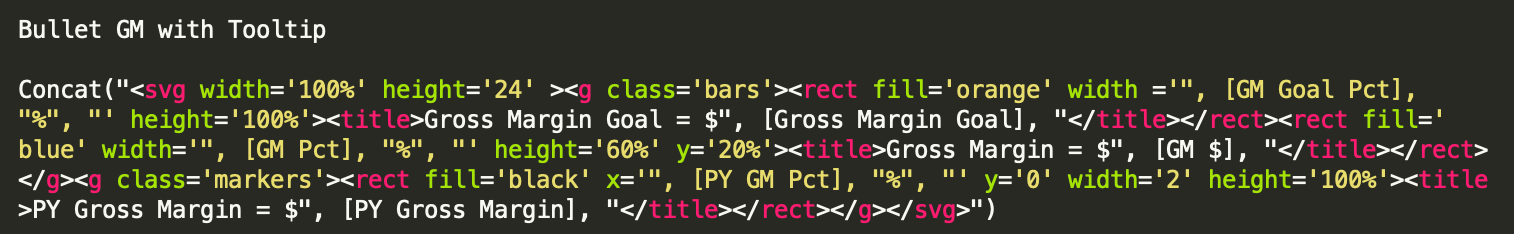
In order to reproduce bullet chart, we will be using <svg> element and “rect” attribute. To understand the syntax, we will use the code below as a reference.
Best practice while using HTML Tags is to use double parenthesis (“) for MSTR functions and single (‘) for HTML functions. Pay attention to spaces as sometimes copy-pasting HTML code into metric formula field may transfer some invisible characters, hence make it impossible to execute the code.
<
svg width
=
'100%'
height
=
'65px'
>
<
g
class
=
'bars'
>
<
rect fill
=
'blue'
width
=
'100%'
height
=
'25'
></
rect
>;
<
rect fill
=
'green'
width
=
'45%'
height
=
'25'
></
rect
>
</
g
>
</
svg
>
You can test it yourself by copy pasting it here: https://www.w3schools.com/tryit/tryit.asp?filename=tryhtml_default
More info on HTML5 SVG tags: https://www.w3schools.com/html/html5_svg.asp
Concat
(
"
<svg width='100%' height='20'>
<rect fill='
#5faeb6' width='"
,
Round
(([
Real
%
Value
-
Perc
.
to
total
]*
100
)),
"%' height='100%' y = '%'></rect>
</svg> "
)
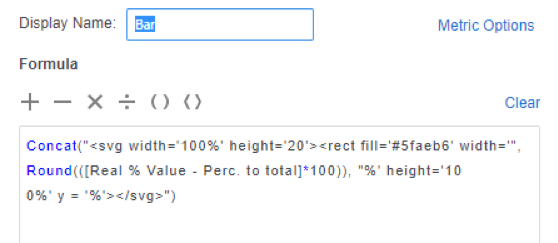
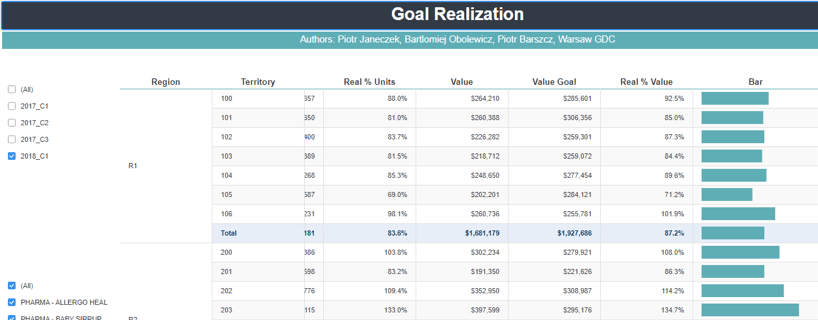
Depending on what we want to see we can show realization to total, realization to plan etc.
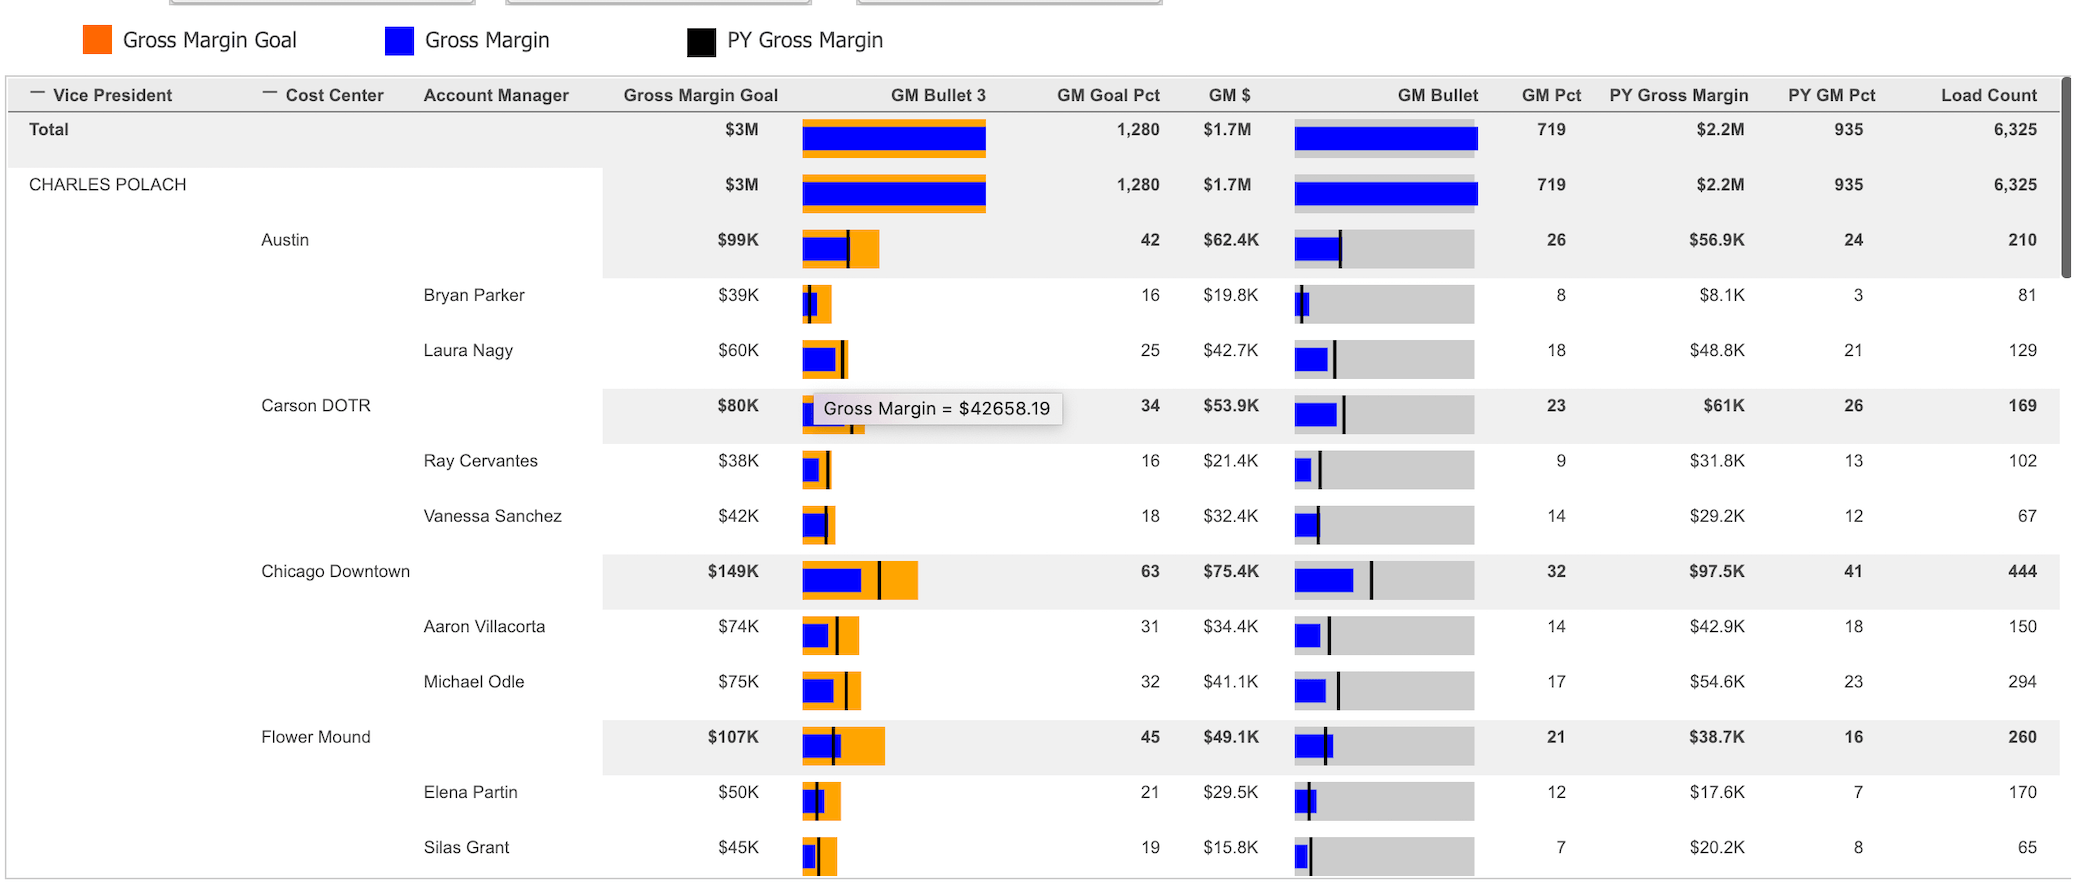
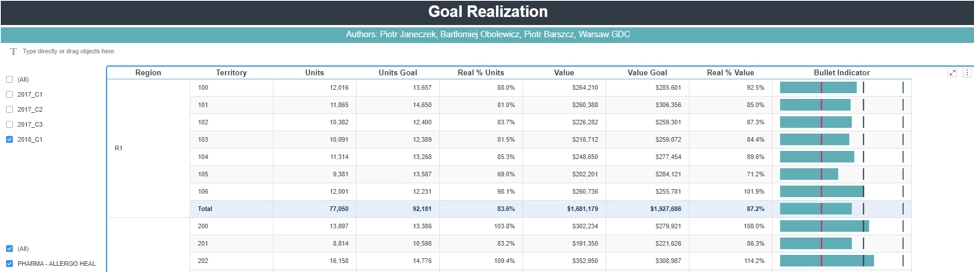
Drag and drop saved metric on the grid and it should show a beautiful bullet bar. Depending which metrics are used this also works with totals and subtotals!
Concat
(
"
<svg width='100%' height='20'>
<rect fill='
#5faeb6' width='"
,
Round
(([
Real
%
Value
-
Perc
.
to
total
]*
100
)),
"%' height='70%' y = '%'></rect>
<rect fill='
#e8175d' width='2' height='100%' x='"
,
Round
(([
Threshold Line
1
st
]/[
Max
Real
%
Values
-
IF
])),
"%' y='0'></rect>
<rect fill='#323a45' width='2' height='100%' x='"
,
Round
(([
Threshold Line
2
nd
]/[
Max
Real
%
Values
-
IF
])),
"%' y='0'></rect>
<rect fill='#3f6184' width='2' height='100%' x='"
,
Round
(([
Threshold Line
3
rd
]/[
Max
Real
%
Values
-
IF
])),
"%' y='0'></rect>
</svg> "
)