SYMPTOM:
[-] When creating a visualization dashboard within Strategy Web 10.4 Hotfix 4, a cross join occurs when a derived metric created from an attribute on the report is used in conjunction with a date range filter.
STEPS TO REPRODUCE:
1. In Strategy Web 10.4 Hotfix 4, within the “Strategy Tutorial”, create a new VI dashboard.
2. Use the “Browse All Objects” option to add the “Category” and “Item” attributes to the visualization, as well as the “Revenue” metric.
3. Add “Category” element "Books" to the visualization filter. This will help reduce the amount of data returned to 90 elements.)
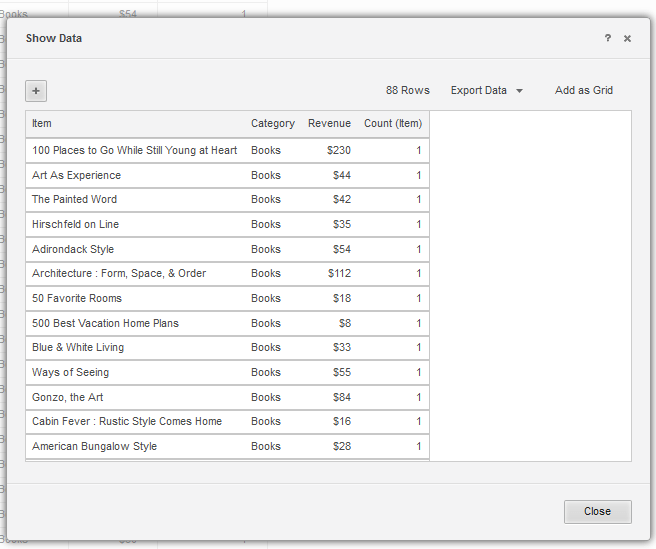
4. Add “Day” to the visualization filter and select from "1/1/2014" to "1/5/2014". This will reduce the data returned to 88 elements.
5. Right click on “Item” and choose the “Duplicate As Metric” option. This will create a Count(Item) derived metric. Add this derived metric to grid and see that you can still see 88 elements.
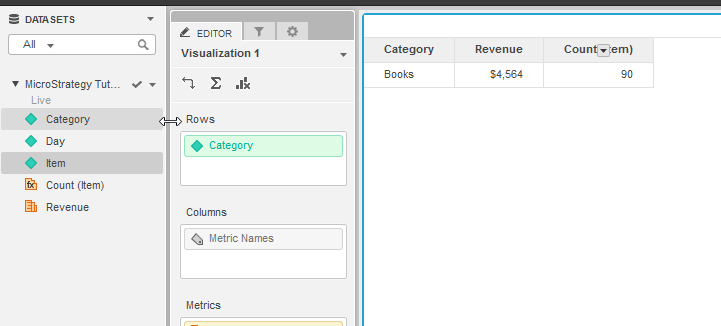
6. Remove “Item” from grid and see that the number of elements is changed to 90, thus ignoring the “Day” filter.
*Note that changing the dashboard properties option "Allow joins across datasets based on unrelated common attributes" or changing the derived metric parameters "Use lookup for attributes" doesn’t resolve the issue.
CAUSE:
This is a known issue with Strategy Web 10.4 - 10.9.
ACTION:
This issue has been resolved in Strategy 10.10. To apply this fix, upgrade to Strategy 10.10 or above and enable the Feature Flag 'Defect fixes that may impact Data, SQL, MDX, and CSI' within the Web Preferences -> User Preferences. For more details on enabling Feature Flags refer to What are the Feature Flag options and what do they accomplish in MicroStrategy Web 10.8 and up. KB440486