This video shows a few tricks and tips to format and enhance your charts in MicorStrategy Dashboards.
Also provided Before / After versions of these charts in the 2 attached dashboards (using Strategy 10.7)
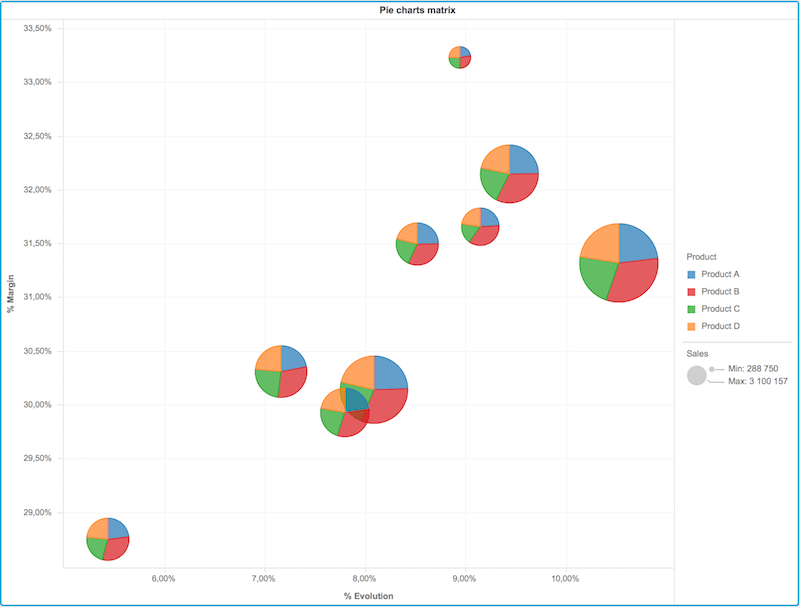
With this video, you will learn how to convert this very simple blue barchart into the powerfull graph matrix below:


Or maybe enhance this very simple chart, to turn it into the powerfull bubble chart below :


And finally enhance the visual of your charts by changing the major/minor gridlines definitions :