Starting with the release of Strategy ONE (March 2024), dossiers are also known as dashboards.

This month, we will be looking at job trends for the City of New York. This dossier analyzes the current state of the job market within the city and more specifically what job prospects are available. The dossier also dives into trends over time to help envision the future of the job market for the City of New York.
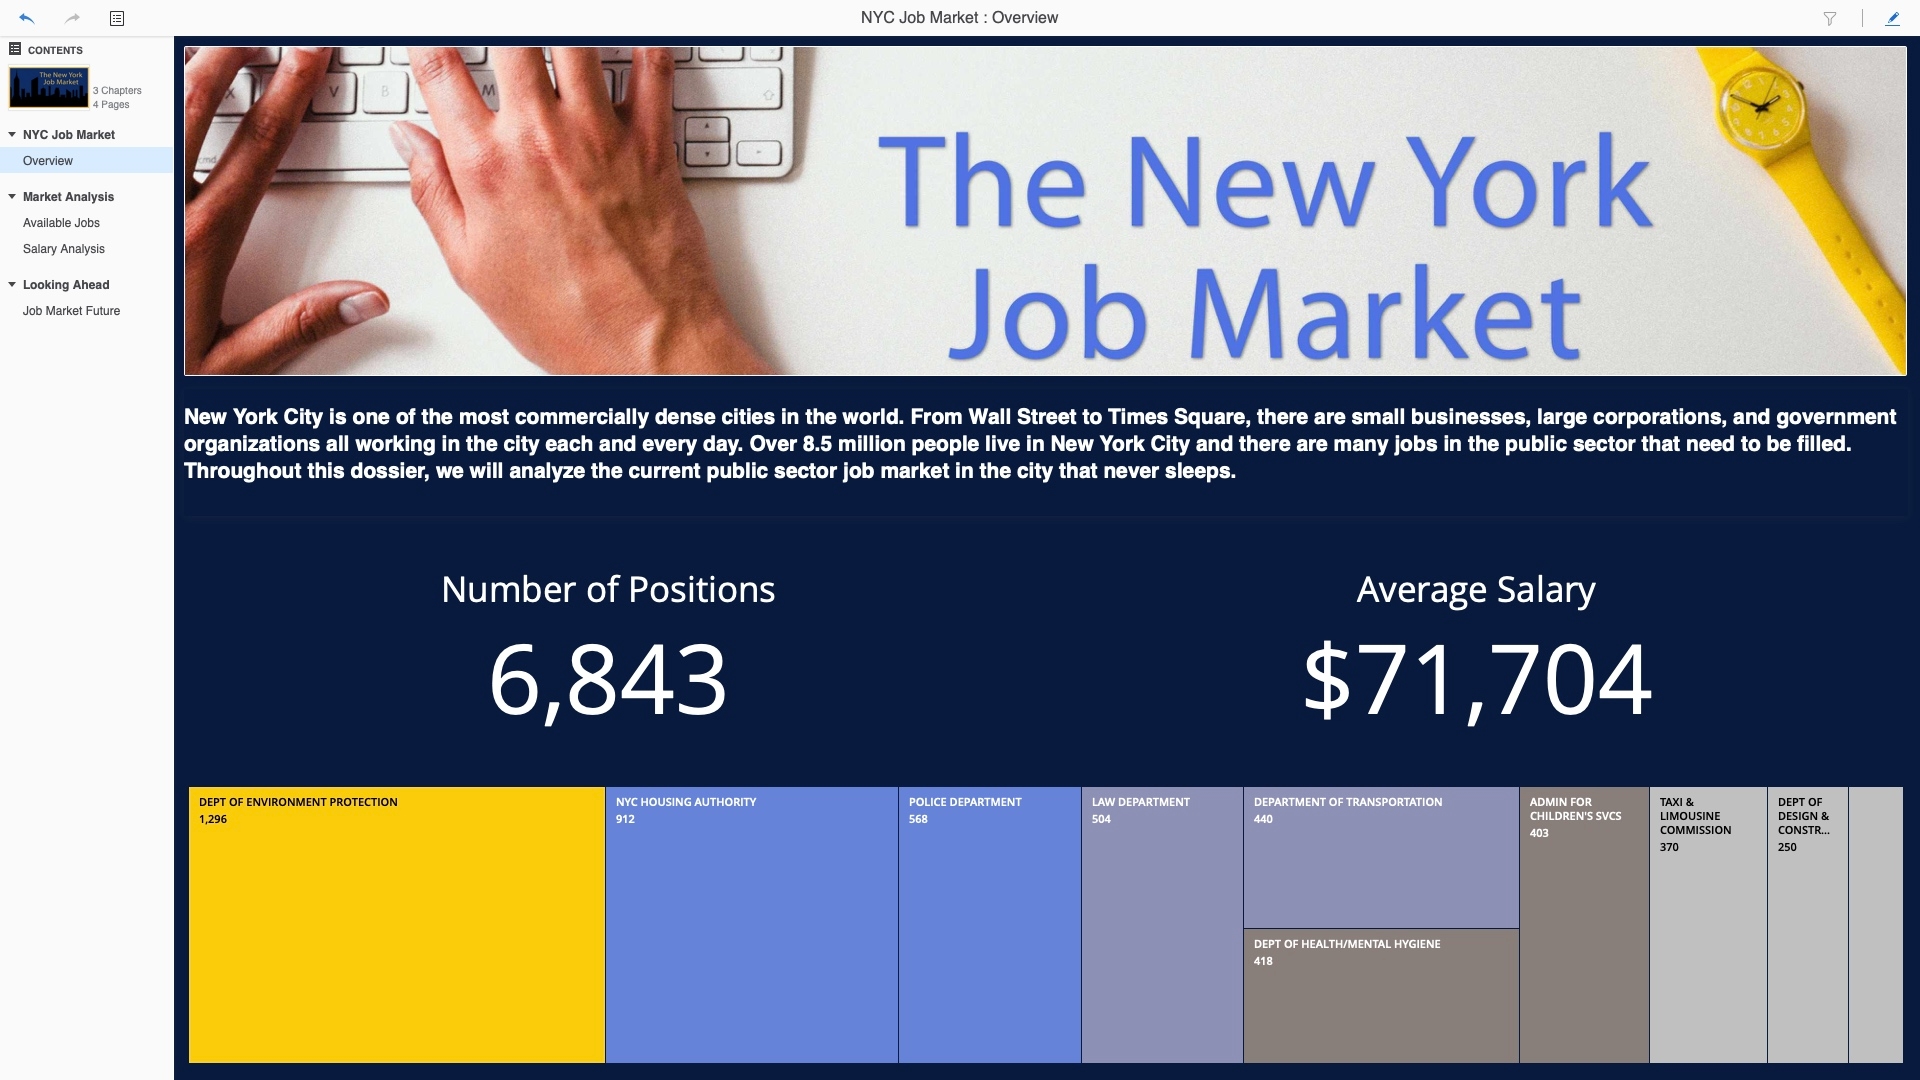
The first chapter of the dossier acts as an overview of the market. There are two primary KPIs that help establish a baseline of knowledge for viewers around the number of positions available and their average salary. Showing these numbers early on makes it easier to make numeric comparisons throughout the dossier. The Heat Map at the bottom is used to illustrate how a few of the government agencies dominate the open job market, namely the Department of Environment Protection and the NYC Housing Authority.
Our second chapter begins with an analysis of job postings and availability over the time period of our dataset. This is a great way to analyze what types of jobs have been posted and what requirements are listed for this jobs. This page includes a filter on Job Posting Type, allowing users to see data for jobs that were posted externally, internally, or either. From here, we have a grid which provides an inventory of job titles by business category that correspond to the job postings data selected. This dossier also includes additional visualizations around monthly trends in Job Postings in New York City (October and November stand out as the most active months), as well as the number of Job Postings corresponding to a particular Civil Service Level requirement (The bar chart shows the majority of job postings to require little to no Civil Service Level). There are also pie charts used to show the breakdown of job postings based on residency requirement, as well as the employment type (the vast majority of job postings are full-time positions).

One of the most important factors in choosing a new job and determining the health of the job market is salary. The Salary Analysis page of the dossier takes an in-depth look at compensation across the available jobs in New York. The filter slider at the top of the page allows you to view a range of salaries that best suit your desired compensation; immediately narrowing the results on all three visualizations below. Out of the open positions analyzed, the median salary was $71,439. The Environmental Protection Agency appears to be a great opportunity as it has the most available positions with an average salary just above the median. Clicking on any data point in the three visualizations will filter the other two to match this selection as well. Both of the pages in the Market Analysis chapter are great for internal research as well as external job hunting.

The final chapter and page in this dossier takes a look at the historical context of the NYC job market in order to give an idea of where it’s headed. Over the last 30 years, the total employment has seen very consistent growth and has grown by nearly a million jobs in that time! Aside from a few down years, it performed very well and the future appears quite promising. On the bottom of page, we can analyze how the total employment faired at the end of each quarter during that same 30-year span. Clicking on any given year will provide you with the KPIs for that specific year.

Utilizing the data regarding the public sector jobs available in New York, we can see opportunity is still abound in New York. The conclusions drawn through this dossier also bode well for private sector growth, as similar trends likely occurred through the technological boom of the past 3 decades. As a new decade is ushered in, many people will be looking to make a change in their life and it would appear that there is no shortage of opportunity.
