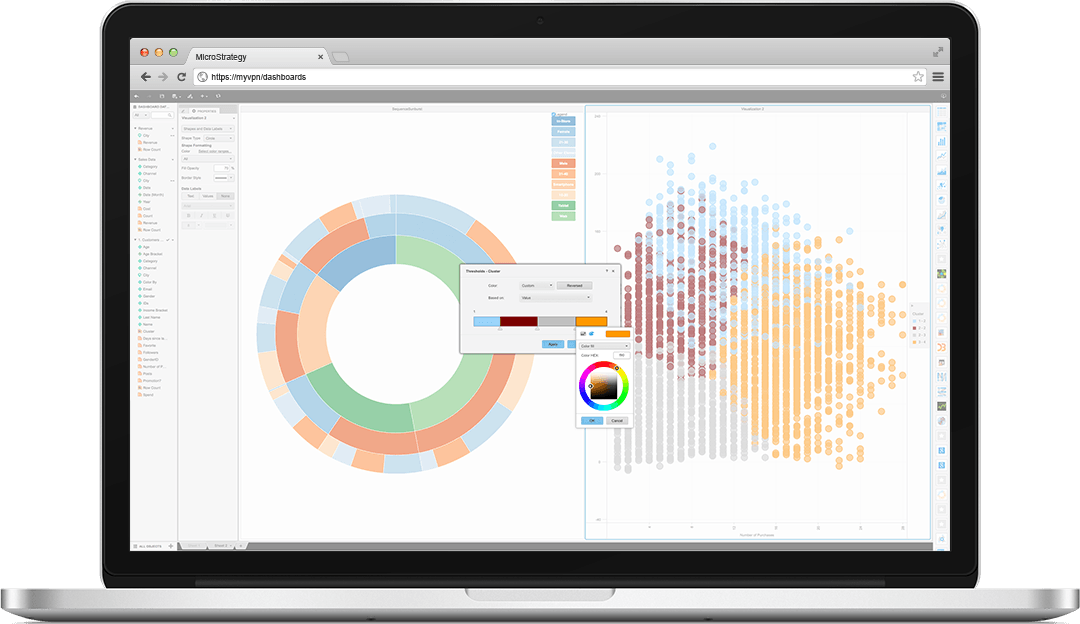
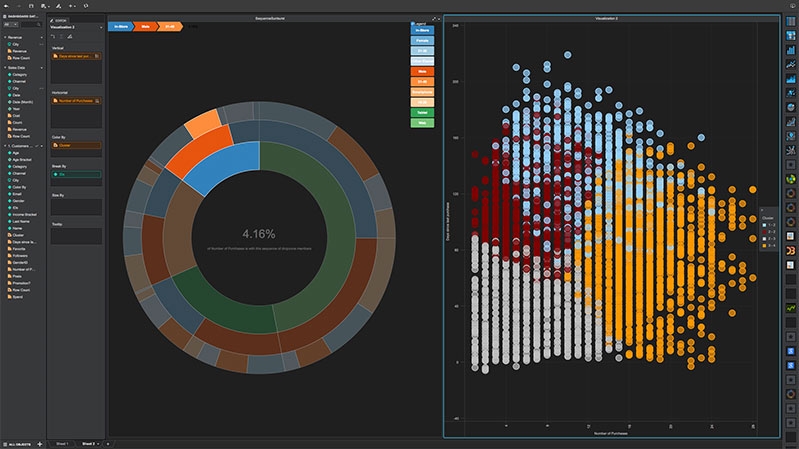
Desktop is a fast, user-friendly desktop tool that lets you intuitively access and explore data to create visualizations in minutes on your PC or Mac. Easily access, explore, and analyze data in just a few clicks with self-service analytics. Experience the speed and flexibility of data discovery without sacrificing the scalability and security of an enterprise analytics environment.
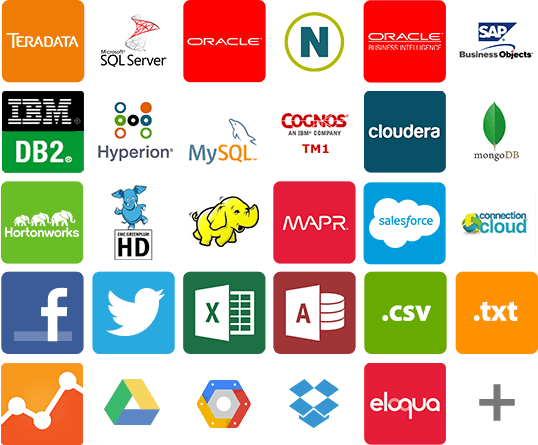
With Desktop, using a variety of native connectors, you can tap into nearly any type of data from spreadsheets to Salesforce reports to big data sources like Hadoop. You can easily blend data from multiple sources for fast, easy analysis, and quickly define relationships across tables or sources with simple drag-and-drop controls.
An extensive library of visualizations and an intuitive drag-and-drop interface make it easy for users to build data discovery dashboards. Quickly visualize data with out-of-the-box grids, graphs, charts, and maps. If that's not enough, it's easy to extend the visualization library to incorporate new third-party visualizations, like D3, or build your own from scratch with our Visualization Builder and SDK. Intuitive, context-sensitive formatting menus make dashboard design in Strategy quick and easy.