Starting with the release of Strategy ONE (March 2024), dossiers are also known as dashboards.
When designing reports or dossiers, developers can leverage view filters to restrict the data displayed on a report, within a chapter or on a single visualization, providing users with a different view of the data. Here you can find easy to follow steps which will help you understand a concept and a way of implementing view filters on your objects created in Strategy Web.
1. Click the name of your report to execute it.
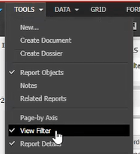
2. From the Tools menu, make sure that View Filter section is enabled.
3. Click Add Condition in the View Filter section to add your filter.
Note: Filters can only be created out of metrics and schema attributes. Depending on the type of object you are filtering on, a different set of choices appears.
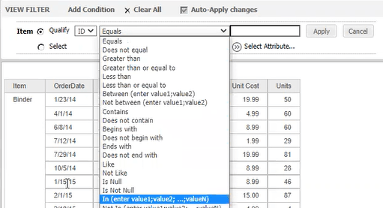
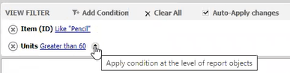
Qualification on allows you to filter data based on an attribute form. For example, to allow users access to data for only those items which number of units sold was greater than 60 or list of Item which ID includes Pencil.
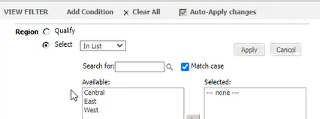
Selecting in list allows you to filter the data based on the list of attribute elements belonging to that attribute. For example, in a dataset containing the Region attribute, you can use an attribute element list qualification to allow access to data for only those regions you specify in your filter.
4. Select attribute or metric to begin with, choose your condition and click Apply to add the new filter to the report.
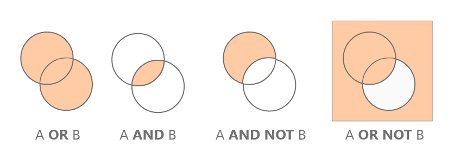
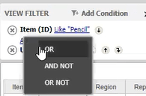
5. You can create multiple qualifications for a single filter, and then combine the qualifications using the logical operators AND, AND NOT, OR, and OR NOT. Click Apply condition at the level of report object.
Note: The default option 'Apply Condition at the Grid Level,' will evaluate the metric qualification only for attributes on the report template. This feature exists so that when users choose 'Apply Condition at the Level of the Report Objects,' the metric qualifications will be evaluated for all attributes, regardless of whether they are on the report template.
For more details go to: How to Apply a View Filter to a Report
The Filter panel limits the data that appears in the visualizations and text on the current chapter. Each chapter is a layer of data, with its own filtering criteria. Using chapter and filters allows you to create different views of data, using different visualizations and filters.
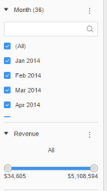
1. Drag attributes or metrics from the Datasets panel to the Filter panel. Press and hold the Ctrl key to select multiple attributes or metrics.
Note: The attributes and metrics appear as filters in the Filter panel. Attribute values appear with checkboxes, and metric values appear on a slider.
2. Click More next to the filter name and choose Display Style to select a style for displaying the filter.
See Filter Display Styles for more information.
3. To create a metric filter, select Qualification or Qualify on Rank to filter the metric values by comparing them to a specific value. Then, select a comparison operator (that is, Equals, Greater than, etc. for Qualification and Highest, Lowest, etc. for Rank) and enter a value in the filter.
4. Check the box beside any filter to apply it and update all visualizations and grid in the selected Chapter.
To add a view filter to a single visualization:
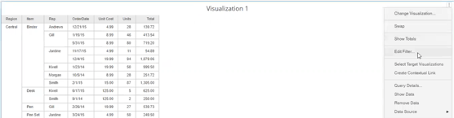
1. Select the visualization you with to filter, then click the Menu icon.
Note: The Menu icon appears as an "ellipses" icon or three dots within a square.
2. Select Edit Filter.
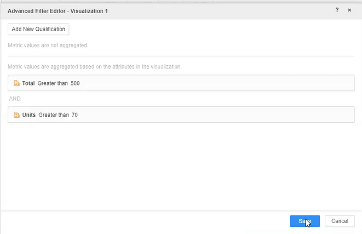
3. Click Add New Qualification.
4. Select the attribute or metric to base the filter on.
5. If you are filtering on a metric, select the operator on which to base the filter.
Note: When adding more than one view filter on a visualization, the default operator used between them is AND, so that result contains both conditions. If you need to use OR operator, see the below workaround.
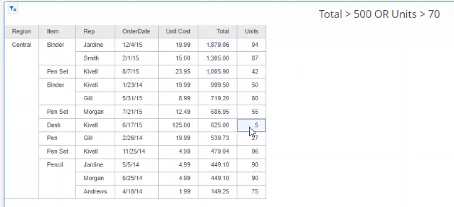
There’s a request from a user to add a limitation on Sales report visualization to display Items with Total Sales value greater than 500 OR more than 70 Units sold.
1. Create 2 derived metrics using Case function which will return 1 if the condition is TRUE else 0. They are based on metrics which should limit your visualization (Total and Units).
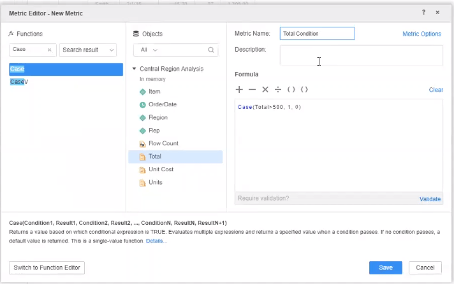
I. Click Create Metric… and then Switch to Formula Editor
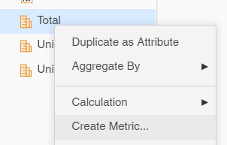
II. In this example, rename it to Total Condition
III. Use the following statement:
Case(Total>500, 1, 0)
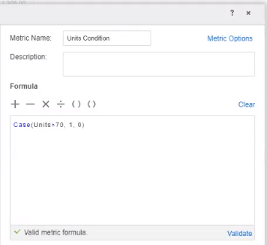
IV. Create another metric called Units Condition, using the following statement:
Case(Units>70, 1, 0)
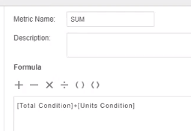
2. Create SUM metric which is a SUM of newly created Condition metrics.
I. Use the following formula:
[Total Condition]+[Units Condition]
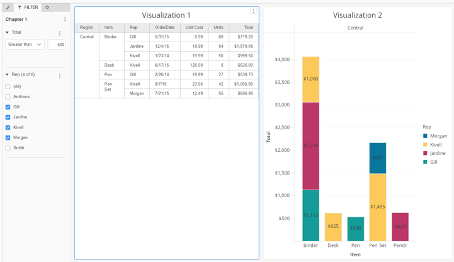
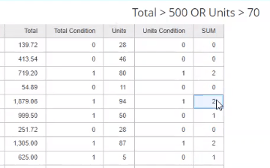
3. Add Total Condition, Units Condition and SUM metrics to the original grid for the results check.
If one condition is true, then SUM metric equals 1, if both conditions are true then SUM equals 2, if neither of the two conditions is true then 0.
4. Click the Menu icon and select Edit Filter.
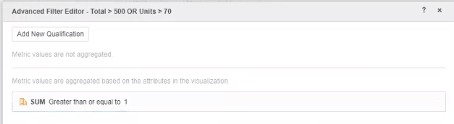
5. Click Add New Qualification using SUM metric:
“SUM Greater than or equal to 1”
That means that at least one condition must be TRUE. In the example above, Total > 500 OR Units value > 70.
6. Remove derived metrics (Total Condition, Units Condition and SUM) from the visualization after results check. Filters will work correctly even if the components are not added in the visualization.
Feel free to start a discussion, visit the Learning Center, or reach out to Strategy for other learning materials!