EducationSoftwareStrategy.com
StrategyCommunity

Knowledge Base

Product

Community

Knowledge Base

TopicsBrowse ArticlesDeveloper Zone

Product

Download SoftwareProduct DocumentationSecurity Hub

Education

Tutorial VideosSolution GalleryEducation courses

Community

GuidelinesGrandmastersEvents
x_social-icon_white.svglinkedin_social-icon_white.svg
Strategy logoCommunity

© Strategy Inc. All Rights Reserved.

LegalTerms of UsePrivacy Policy
  1. Home
  2. Topics
  3. Donut Chart by Vitara

Donut Chart by Vitara


Community Admin

Placeholder •


A donut chart is essentially a Pie Chart with an area of the center cut out. However, Donut Charts have a slight advantage over Pie Charts, which are sometimes criticized for focusing on relative sizes of the pieces to one another and to the chart as a whole, giving no indication of changes as a whole when compared to other Pie Charts.

Starting with the release of Strategy ONE (March 2024), dossiers are also known as dashboards.
A donut chart is essentially a Pie Chart with an area of the center cut out.
However, Donut Charts have a slight advantage over Pie Charts, which are sometimes criticized for focusing on relative sizes of the pieces to one another and to the chart as a whole, giving no indication of changes as a whole when compared to other Pie Charts.
A Donut Chart partly addresses this problem by de-emphasising the use of area, to make the viewer focus more on the changes in overall values. You are focused on reading the length of the arcs, rather then comparing the proportions between slices.
Also Donut Charts can take up less space then Pie Charts by having their centers used to display information within their blank centers.
VitaraCharts Donut can be used to not only display a single KPI but add several other KPIS to the tool-tip section. Also, the Play axis is available to show the variation of the Donut across over time .

ka0PW0000001JQAYA2_0EM440000002Lss.png

Requirements:

  • 1 attribute ( used in slice by )
  • 1 metric  (for Donut slices )


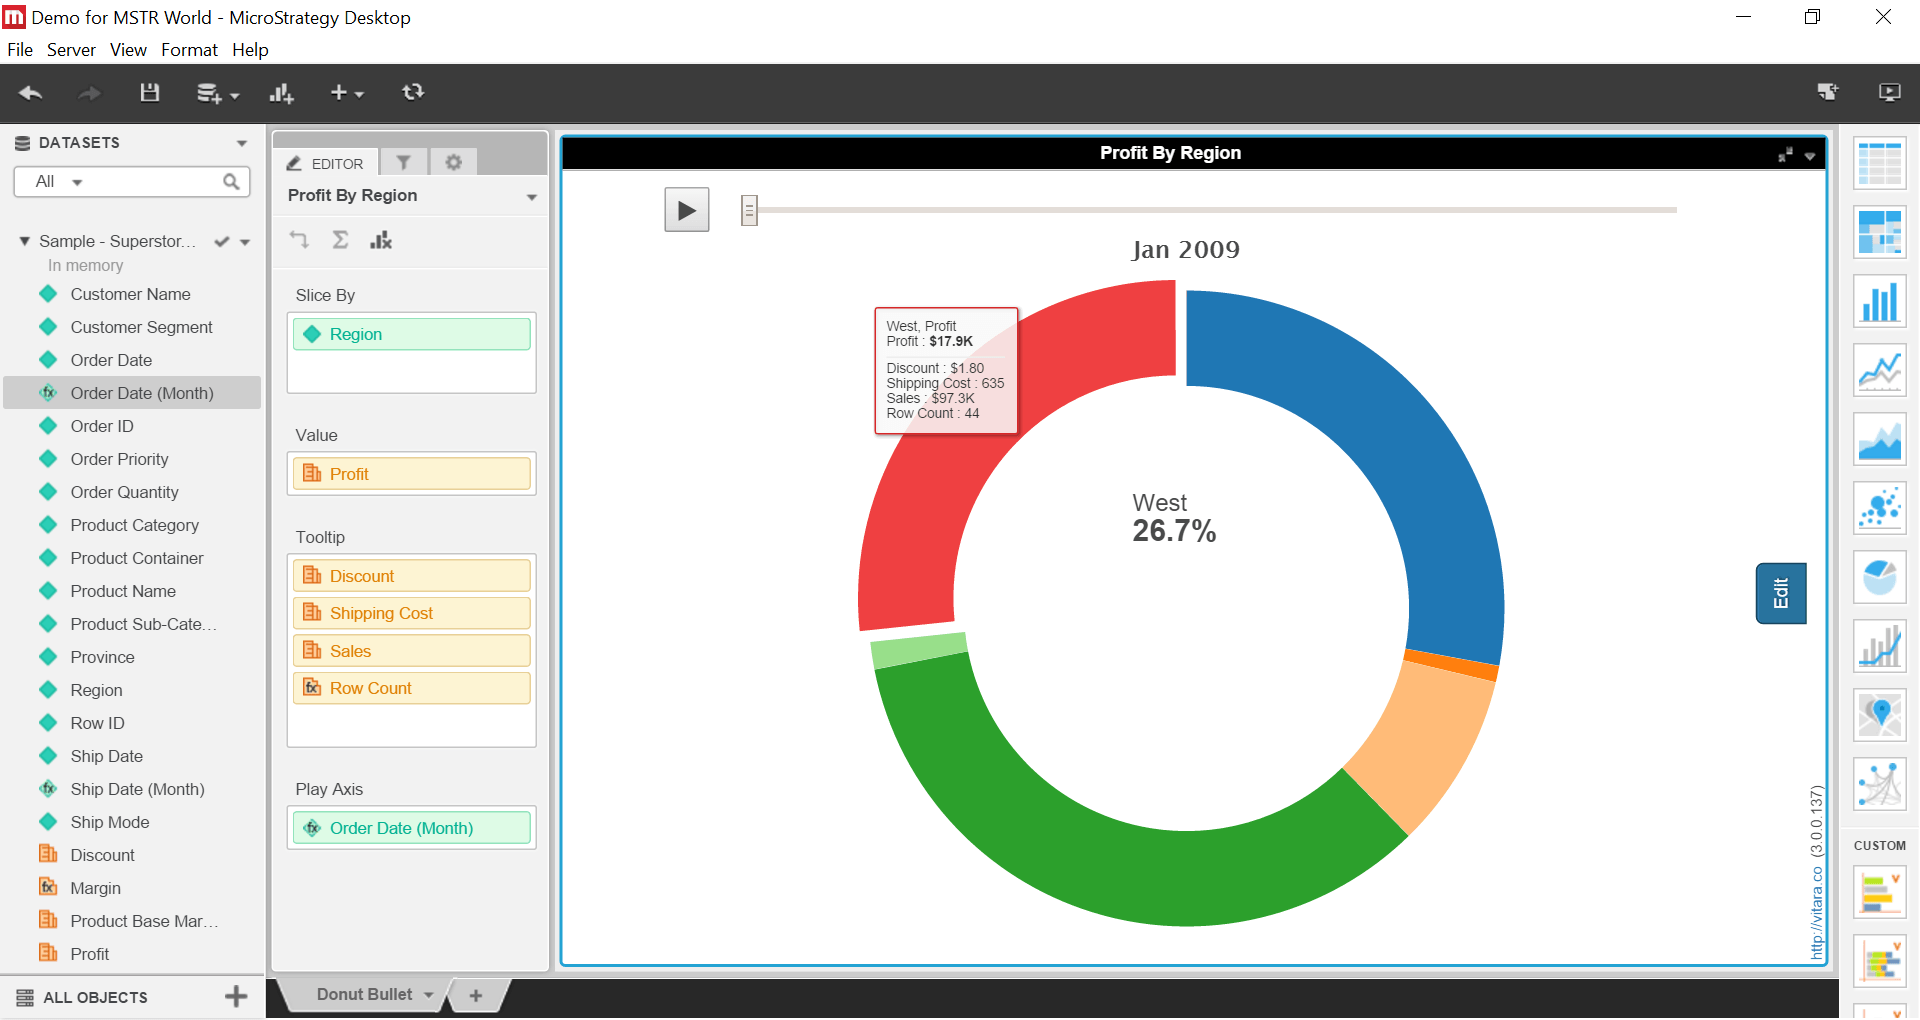
NOTE: Time attribute ( Optional for Play Axis) and additional Metrics can be added to Tooltips as shown in screenshot.
 
Minimum Strategy version: 10.3
Chart Version : 3.0
 
MicroStrategy Features

  • Fully customizable with editors in Dossier or Web Report Services Documents (DHTML widgets) for appearance
  • Compatible with all supported versions of Strategy Desktop, Web, Library and Mobile

Vitaracharts is now FREE for Desktop and Workstation. 
Please contact sales@vitaracharts.com to get a 30-day trial key.
Take note that this visual is a part of the VitaraCharts library.
Download visualizations: www.vitaracharts.com
Online interactive visualizations can be accessed here: https://cloud.vitaracharts.com
Publisher: Vitara
Vitara is a Strategy technology partner and offers a fully supported, production-ready chart plugin (VitaraCharts) with 30+ stunning visualizations to enhance Strategy analytics. All Vitara visualizations are customizable and supported through upgrades for a hassle-free experience. We perform extensive testing for backward compatibility with all currently certified versions of Strategy and also ensure all new versions of Strategy are tested and supported across all charts.
 
For more details please contact sales@vitaracharts.com or www.vitaracharts.com.

Web

  • Download the zip file from https://s3.amazonaws.com/vizpackage/Release/3.0/3.0.0.141/VitaraCharts.zip
  • Extract the VitaraCharts folder from the zip
  • Stop WebServer (IIS/Tomcat or equivalent)
  • Delete VitaraCharts folder under plugins directory if one exists
  • Copy over the new version of the VitaraCharts folder into the plugins folder of your Strategy web installation. For instance if Web is installed under c:\tomcat\webapps\Strategy, you will place VitaraCharts under c:\tomcat\webapps\Strategy\plugins
  • REPLACE  the license.txt file in the VitaraCharts folder with the license file provided to you
  • Start WebServer.
  • Clear Caches and Restart client browser.

Desktop


  • For Desktop use, just import the downloaded VitaraCharts.zip file as a new visualization (File->Add Visualization from File) https://s3.amazonaws.com/vizpackage/Release/3.0/3.0.0.141/VitaraCharts.zip
    • Now REPLACE the license.txt with the version provided to you.
      • On Windows, look for the license.txt file under C:\Program Files\Strategy\Strategy Desktop\code\plugins\VitaraCharts
      • On a Mac, in order to locate license.txt.​
        • go to Applications
        • locate Strategy Desktop
        • Right click on it and choose ‘Show Package Contents’
        • Now navigate to Contents -> Resources -> code -> plugins -> VitaraCharts
        • The license.txt is in this folder and needs to be replaced.

Mobile

  • Download the zip file from https://s3.amazonaws.com/vizpackage/Release/3.0/3.0.0.141/VitaraChartsMobile.zip
  • Extract all the folders from the zip file (There will be a separate folder for each visualization in addition to the VitaraCharts folder)
  • Stop WebServer (IIS/Tomcat or equivalent)
  • Delete VitaraCharts related folders under plugins directory (if any exist)
  • Copy over the new version of the just extracted folders into the plugins folder of your Strategy mobile installation. For instance if mobile server is installed under c:\tomcat\webapps\StrategyMobile, you will place all folders under c:\tomcat\webapps\StrategyMobile\plugins
  • Replace the license.txt file in the VitaraCharts folder with the license file already provided
  • Start WebServer.
  • Connect your ipad to the mobile server

NOTE (for mobile):

  • For custom visualizations to work in mobile, you need to also include the MobileBase plugin provided by Strategy in the mobile plugins directory.
  • Report Services documents are fully supported (for viewing) in mobile
  • There are some limitations for viewing VI dashboards in mobile. These limitation will be removed in a soon to be released update.

Upgrade from previous VitaraCharts version

  • Download the zip file from https://s3.amazonaws.com/vizpackage/Release/3.0/3.0.0.141/VitaraCharts.zip
  • Extract the VitaraCharts folder from the zip
  • Stop WebServer (IIS/Tomcat or equivalent)
  • Backup your VitaraCharts\license.txt and VitaraCharts\custom\global.txt
  • Delete the current deployment of VitaraCharts in the Strategy plugins folder.
  • Copy over the new version of the VitaraCharts folder to the plugins folder.
  • Replace the license.txt file in the VitaraCharts folder with the backup you created earlier.
  • Copy over the color palette information (Corporate1,Corporate2, Corporate3) from the backup of the global.txt into the global.txt present in VitaraCharts\custom
  • Start WebServer.
  • Clear caches in your client browser and restart browser
  • Access Strategy web to open a dashboard or document with VitaraCharts included.


Comment

0 comments

Details

Example

Published:

May 16, 2017

Last Updated:

March 21, 2024