Starting with the release of Strategy ONE (March 2024), dossiers are also known as dashboards.

Let's say you have a lot of cool data and you want to find some actionable insights. For example, there might be some Google Analytics data that you want to use to determine the pages on your site that get the most views and the pages that are not doing too hot. To showcase the data, you are thinking of building an impactful dossier to share with your team. You already know the basics of dossier authoring but are still looking for some best tips and tricks from the Strategy experts. Well, awesome—you’ve come to the right place!
Read on to create a meaningful dossier.
Craft your story.
When thinking about creating a dossier, the first questions I always ask are “who will see this data, who are the stakeholders?” By asking these simple questions, I am able to better understand how to present the data and what visualizations to use. Not to mention, I will know how to better organize all of the data, presenting all of the key information up-front. Here at Strategy, we think of this thought process as “crafting a story.”
To do this, ask yourself three main questions:
1. What story do you want to tell?
2. Who is your audience?
3. What is the point of your dossier?
Tip: Set up a few meetings to conduct multiple stakeholder interviews. These can be as formal or casual as you like but help you get the information you need to start building the dossier.
Before jumping into dossier design best practices...

Here are a few reasons why I love using dossiers to share data.
1. First off, all your data is in one place.
2. You have dynamic data–you aren't looking at last month's static report.
3. Interact with the data in real time (with targeting, filtering, and more).
4. Notice surprising patterns with visualizations.
5. Tell a story with your data using the dossier chapter/page format.
Now that that’s settled, let’s jump into some best practices for dossier authoring.
We’ve gathered our top tips and tricks all in one place.
Let’s get started.
1. Outline Pages and Chapters
Think about your flow and breakdown of information so it is consumable.
Strategy dossiers are built like books, organized into chapters and pages. Just like a book, you want to tell a story with your data that has a beginning, middle, and end.
Start with an overview that highlights key metrics and sets up the "data world" you will be exploring with your next chapters.
Next, organize each chapter around a question you want to investigate. The pages will help answer the question with relevant data and visualizations.
End with actionable insights. Now that you have your audience paying attention and living in your data world let them know what they can and should do next. Maybe discounting inventory that isn't selling or rewarding top performers.
Check out video this to see how to navigate pages and chapters in Strategy Library.
Tip: If you have data that doesn't fit in with your story, then put it in an Appendix chapter or save it for another dossier.
2. Avoid Unnecessary Data Blending
Data blending is the process of combining data from multiple sources into a working dataset. For example, you might have a cube with customer sales data and you also want to bring in data from a customer satisfaction survey. You want to make sure you have a common unique identifier in both data sets so you can analyze both data sets in the same dossier and look for trends. In this case, you might use customer name as the unique key, but you would have to ensure names were spelled exactly the same in both sets. Otherwise, using a customer ID would be best.
Before you do this, think about the data you have and where it comes from. If you aren't using certified reports or cubes that have been built by an expert, then make sure you understand your data when using data import. Understand how the data is structured and how you can link your datasets.
After you blend your data, check that the data matches the original sources to confirm you have blended correctly. Look at the original data and compare with the data in a grid in your dossier. If you aren’t familiar with the data, work with someone who is an expert and knows the original data and could confirm the data integrity.
3. Use Pause Mode
A time-saving trick is to lay out your pages in pause mode. This allows you to edit without retrieving data. You can use pause mode while authoring or even before running your dossier.
1. Right-click your dossier and choose:
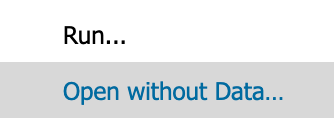
2. Click the pause mode button while authoring:
4. Delete Unused Derived Objects
Keep your dataset clean.
When you are experimenting with different derived attributes and metrics you might find yourself with a dataset panel that looks like the following images:
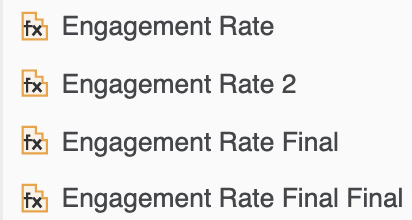
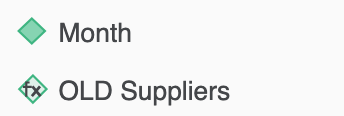
Excess derived metrics and attributes won't be calculated if they aren't being used on a page; however, it can lead to other users using the wrong metric.
5. Capitalize on Responsive Design
If your dossier will be viewed on a mobile device, use responsive design to choose what visualizations display next to each other. For example, you might have some KPI visualizations that you want to group together to make it easier for your end user to understand the data.
Watch this short video to learn how to use responsive design:
Note: Consider your end users' default browser scaling. For example, if you design a dossier with 100% OS scaling, it will most likely look cramped in a browser set to 150%. Reserve some space so the canvas can adjust when your users zoom in. Additionally, consider why your users might be zooming in. Do you need to place fewer items on the screen? Decrease padding and increase font size?
6. Use Targeting to Drill into Data
Use targeting to allow your users to drill into more details. You don't want to include every relevant metric on the same grid and overwhelm your audience. Since you want each page to tell a story keep related metrics together, so it is easier to consume.
For example, use a visualization to show the bigger picture and then include a targeted grid with more details below or on another page.
You have a couple of options with targeting:
1. Use a visualization as a filter on the same page (how-to video here).
2. Use a visualization to filter another page (how to video here).
7. Add Some Color with Color Palettes
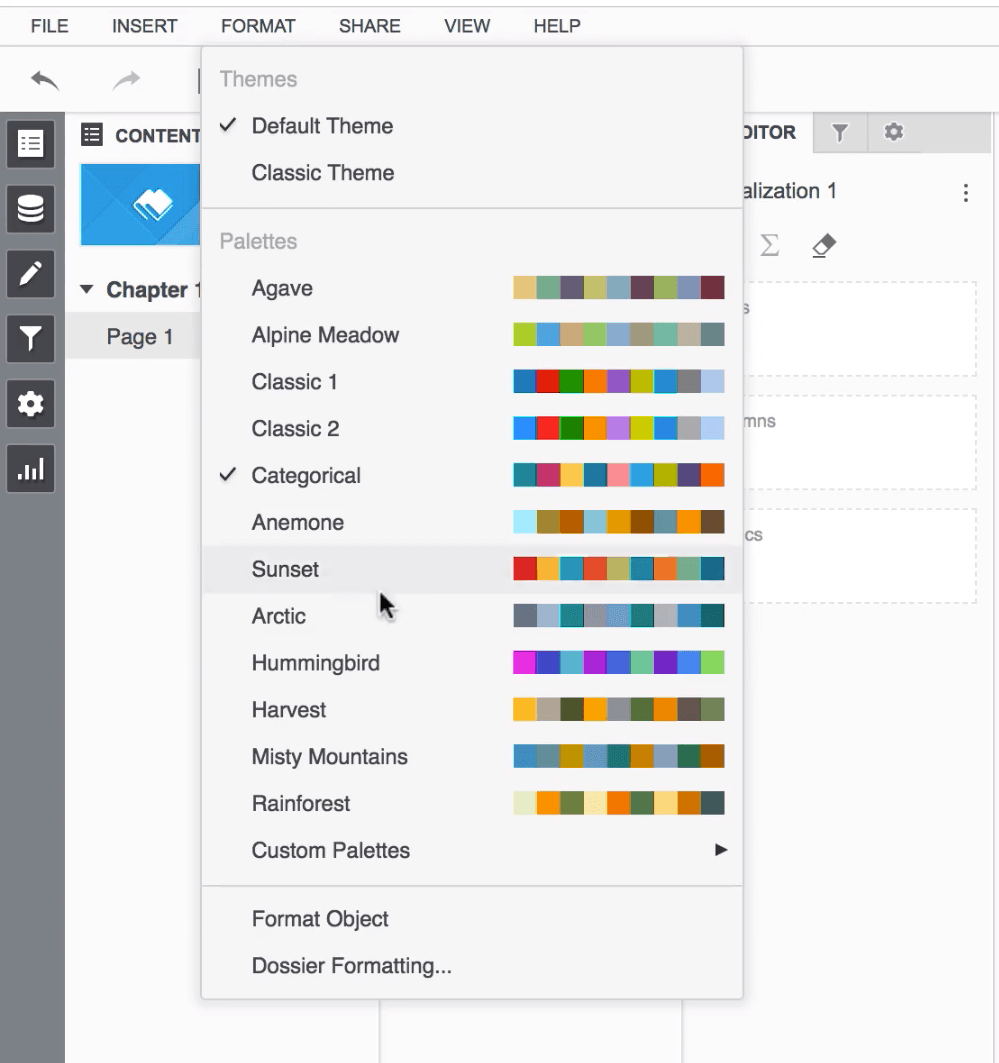
You can use the out of the box color palettes or create your own to match your corporate branding. Feel free to use a color palette that matches the tone of your dossier.
For example, you might use Arctic's darker blues and grays for a more professional look. Our team recommends using the Categorical or Classic color palettes when you have many attributes in your visualizations that need a wide range of distinguishable colors. The following image previews some of our Strategy presets.
Tip: Find your corporate color codes and add to a custom color palette.
Learn how to create a custom color palette in this video.
8. Share your Dossier
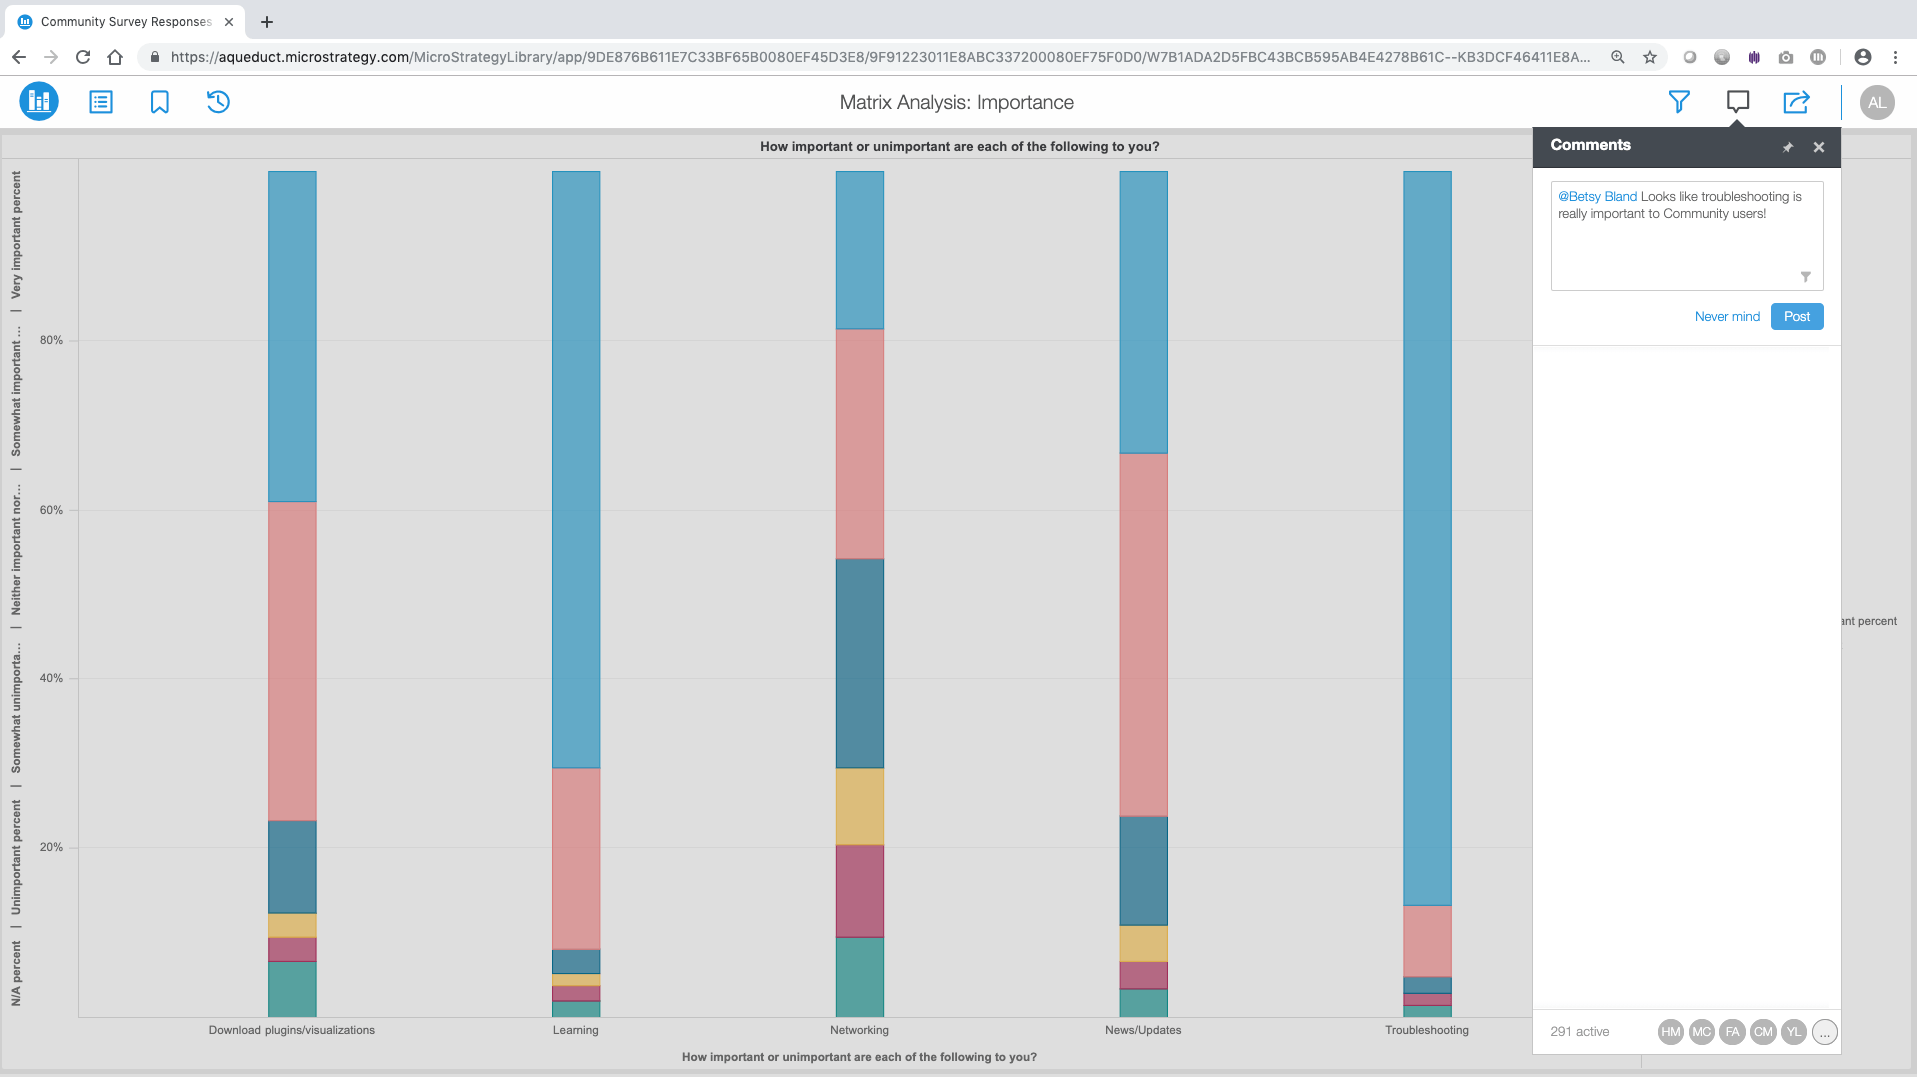
Now that your dossier tells an impactful story and looks great, tag the people who can use the data to drive business decisions.
When you tag someone, they will see the notification in Library directly and get an email reminder. You can also get a share link to email or ping to your colleagues across the enterprise.
Watch this video to learn how to use collaboration in Library.
Want more resources to get going with dossiers?
Q: Looking for more how-to videos?
A: All of the above videos live on Community's Learning Center – check it out!
Q: Not sure where to start with Strategy? No worries, we got you covered.
A: Choose from the roles to help you get started and find your learning path. We have the…
Analyst , Application Architect , Analytics Architect , Business User
Q: Do you have any other tips and tricks for creating different out-of-the-box visualizations?
A: Yeah of course! Check out this playlist to learn how to create some of our favorite Strategy visualizations!
Q: How do I download and use custom visualizations?
A: Download custom visualizations from our Community gallery.
Quick steps to import custom visualizations in Workstation:
1. Download the zip file for the visualization from Community gallery.
2. In the visualization panel, click the plus button in the “Custom” section and choose “Import Visualization”.
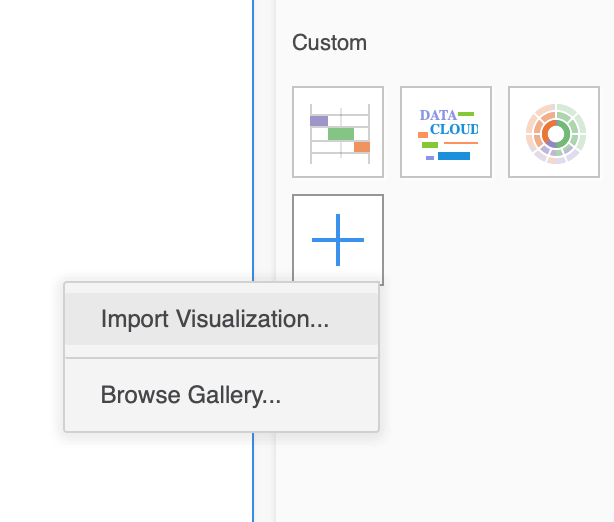
3. Select the zip file and click import.
4. Now your visualization will appear in your visualization panel.
5. Use your new visualization to tell a story with your data!