Starting with the release of Strategy ONE (March 2024), dossiers are also known as dashboards.
Thresholds are a versatile feature in Strategy and they can immediately help the end users identify if actions or items to pay attention to with a simple visual queue. In this example we have a simple grid with 4 rows:
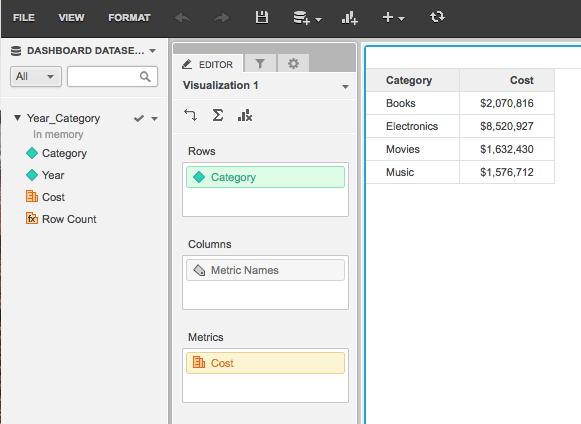
Let’s say that the end user wants to replace the cost metric value with a red down arrow like this one on rows where cost is greater than 2 million:

You apply this change in your Dossier and you end up with the following grid:
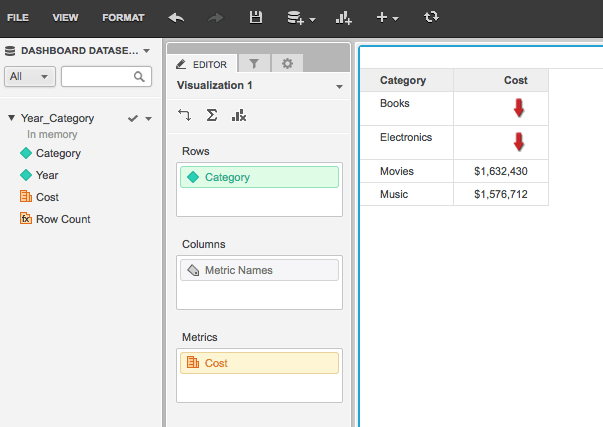
In the previous example it doesn’t look like a big problem to use an image in a threshold, however if for example you had 8 metrics and 1000 rows, you would be rendering 8000 metrics, which can significantly impact the performance.
Using the same example, instead of using an image we can replace it with a ↓ symbol, if you apply the change in the threshold in the previous example you’ll end up with the following output.
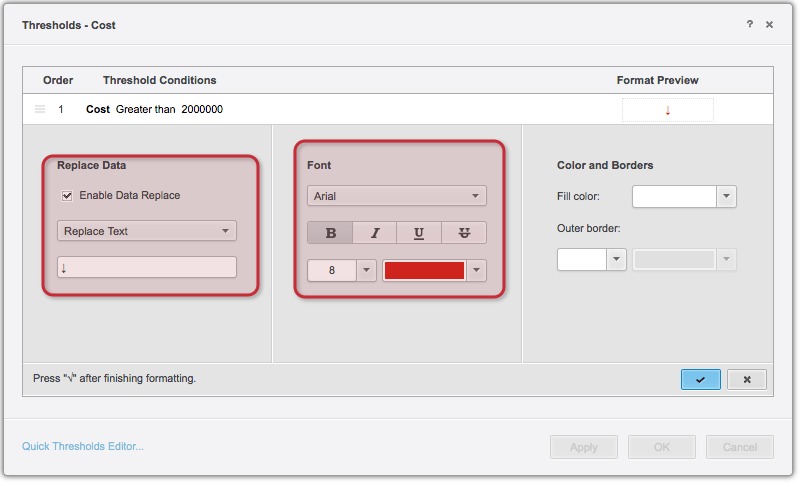

Using symbols instead of images in thresholds can significantly improve the performance. Rendering an image takes more time than rendering a symbol, symbols are characters like letters, hence rendering them is faster.
Also, note how using symbols looks cleaner and provides with more formatting flexibility, for instance, in the image above, the cell spacing in Category when you compare the image threshold to the symbol threshold makes the formatting look off. Also using symbols allows you to control the symbol size in the font size section, you can’t do this with an image.
You can easily find symbols on the internet, in the following page you’ll find multiple symbols and you can search for them:
http://www.i2symbol.com/symbols/
In conclusion, use symbols whenever possible in thresholds. Use images in thresholds as a last resource.
KB442450
