EducationSoftwareStrategy.com
StrategyCommunity

Knowledge Base

Product

Community

Knowledge Base

TopicsBrowse ArticlesDeveloper Zone

Product

Download SoftwareProduct DocumentationSecurity Hub

Education

Tutorial VideosSolution GalleryEducation courses

Community

GuidelinesGrandmastersEvents
x_social-icon_white.svglinkedin_social-icon_white.svg
Strategy logoCommunity

© Strategy Inc. All Rights Reserved.

LegalTerms of UsePrivacy Policy
  1. Home
  2. Topics

Drillable KML maps


Matthew Pepper

Principal Sales Engineer • Strategy


This video demonstrates the ability to create customized KML maps that can be drilled into for detailed analysis

Some further details of the steps:
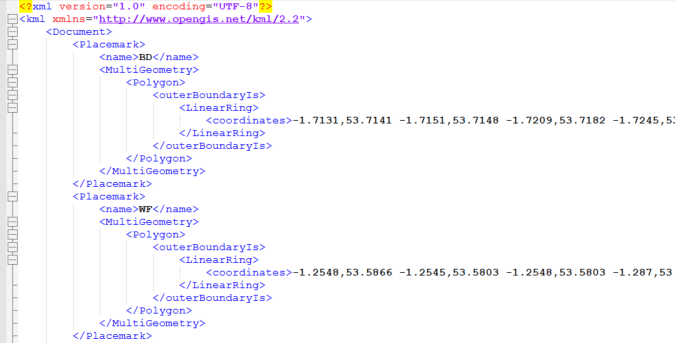
Create KML file(s) based upon your data using a tool such as QGIS.
When creating the file ensure:

  • The line <name>BD</name> equals the attribute form that will be in your data (e.g. in the image below “BD” = Postcode Area in UK)
  • Decimals for Lat/Long are kept to a maximum 4 decimal points to reduce the size of the KML (improves rendering speed)


ka044000000kPBgAAM_0EM440000002Ldi.png

In your Plugins folder, create a Custom Shapes folder as per TN47442
Add your KML file to the folder
 
Edit the mstrGeoShapesConfig.xml to include your KML layers (see the next image – we’ll follow just PostCodeAreas…)
 

ka044000000kPBgAAM_0EM440000002Ldn.png

 
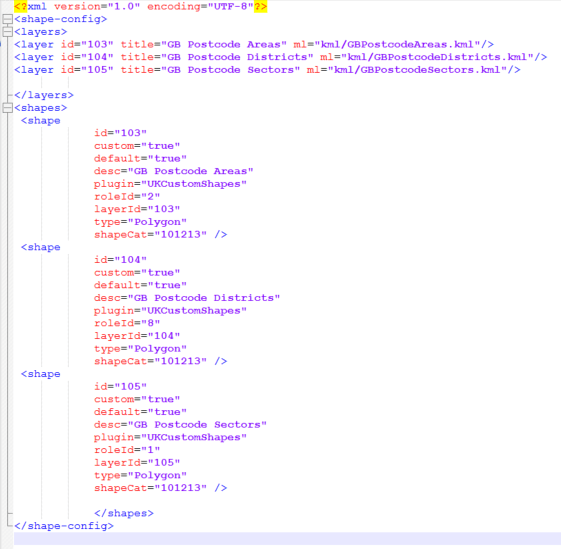
Ensure “default=true” is included, so that the shape file renders on the map by default
Add an existing geographical roleId that exists within MSTR: http://www2.microstrategy.com/producthelp/10/GISHelp/Lang_1033/topics/ESRIMapsIntegration/Setup/ESRI_ESRIConfigFile.htm
 

ka044000000kPBgAAM_0EM440000002Lds.png

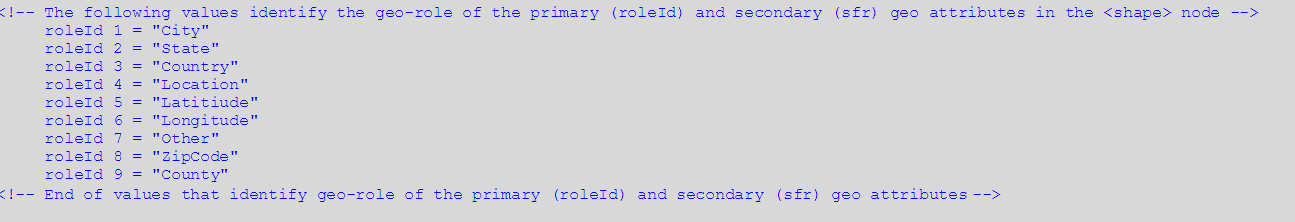
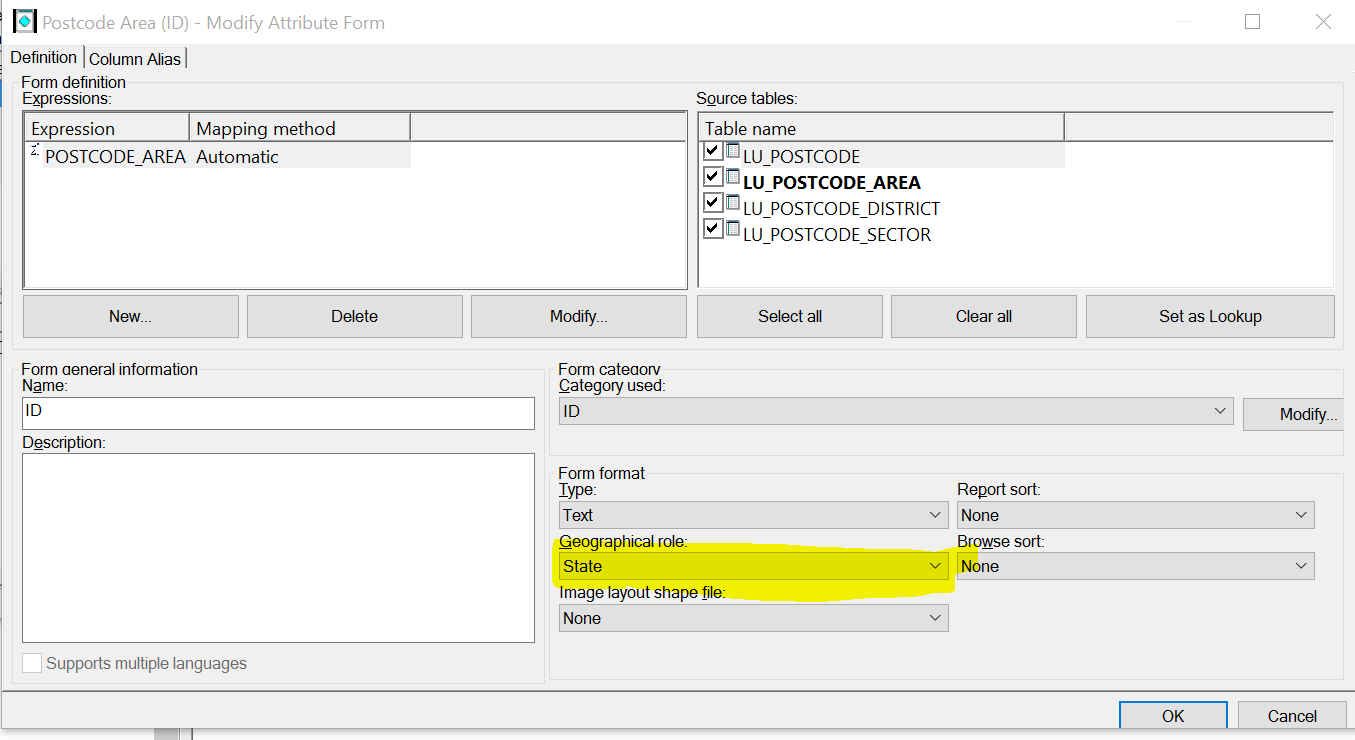
I’ve selected roleId=2 “State” for Postcode Area
Log into Developer and create you attribute, ensuring you link Postcode Area to State Geographical Role.
 

ka044000000kPBgAAM_0EM440000002Ldx.png

 
Repeat for each KML you have.
 
Restart Web server.
 
Before building a schema, you may want to load some data into VI and test the KML works.
Ensure that the ID of the data matches what is in the KML file (e.g. BD, SM, RG for my dataset).
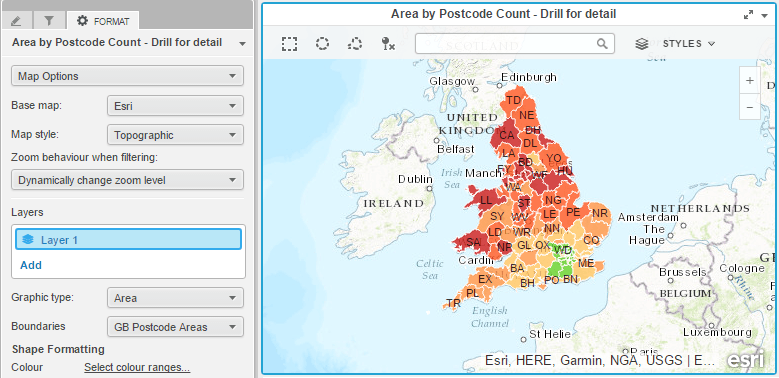
Create a map and drag this attribute into the visualisation. Ensure that the Graphic type is “Area”, and the Boundaries should have your new KML labelled:

ka044000000kPBgAAM_0EM440000002Le2.png


Comment

0 comments

Details

Knowledge Article

Published:

May 19, 2017

Last Updated:

May 19, 2017