Starting with the release of Strategy ONE (March 2024), dossiers are also known as dashboards.
Strategy Best Practices
Dynamic Custom Group in Dashboards or Dossiers
Custom groups enable users to view specific elements based on a metric or specification. For example, you may want to see all the customers in a retail store that bring in over $1,000k in revenue per month, or a teach may want to only view data on students who scored over 2000 on their SATs.
The Scenario
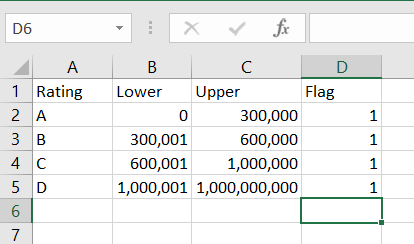
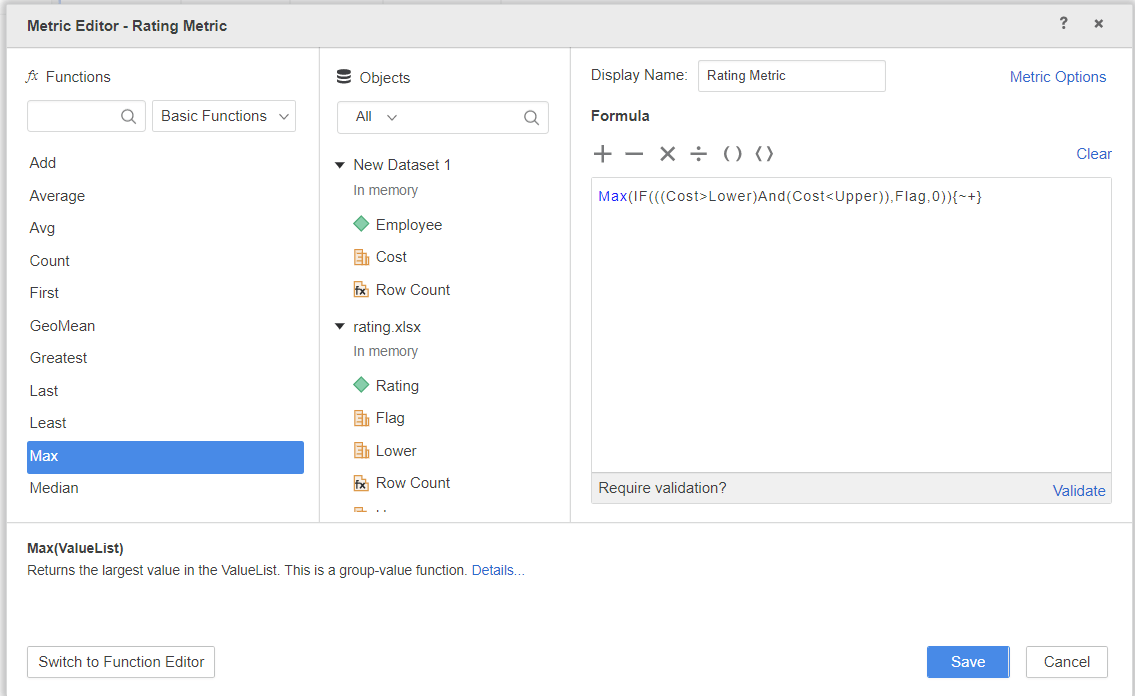
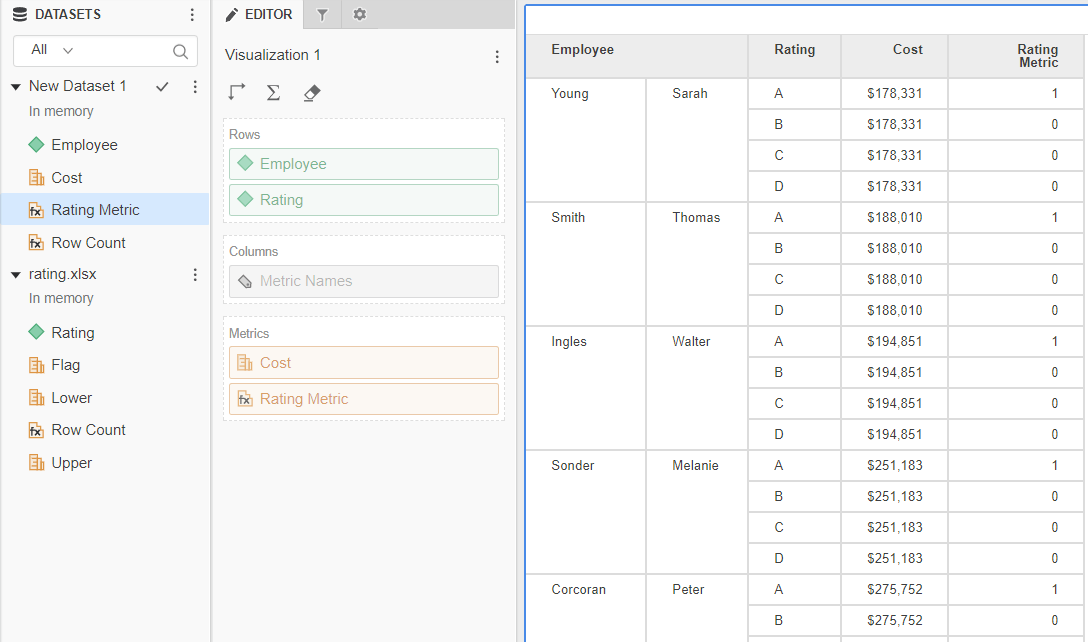
Let's assume you have a table that clusters your Employees by the Cost brackets. Based on those brackets a Rating is defined (like A, B, C...). This table can be imported from Excel file or from a table in relational database.mPlease notice there is a Flag column that contains value '1' for each row. If you don't have this column in your data don't worry! Just use the Upper column instead in the formula (see formula of 'Rating Metric' below). Continue on with the process.
Methods for creating a custom group
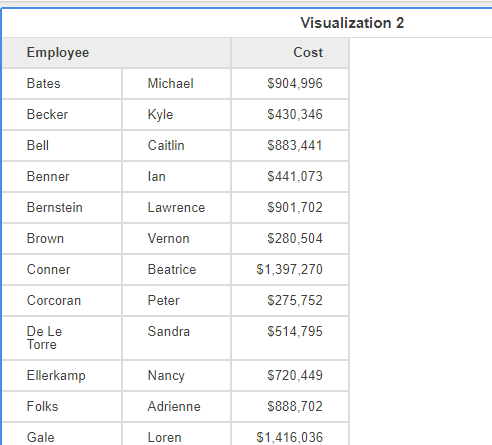
Currently, your Dashboard or Dossier displays Cost per Employee, but it is missing Rating information. Continue on through the numbered steps that are labeled with images to help you along the way.
The images will act as a guide through the process.
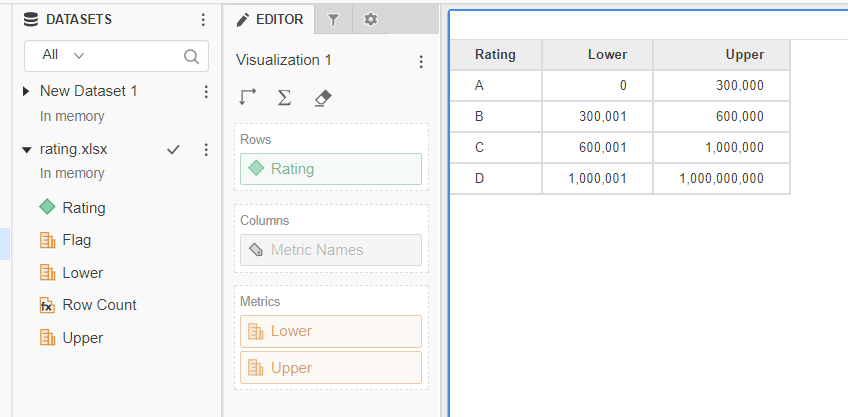
As a first step import your Rating table.
Max(IF(((Cost>Lower)And(Cost<Upper)),Flag,0)){~+}
Final Report
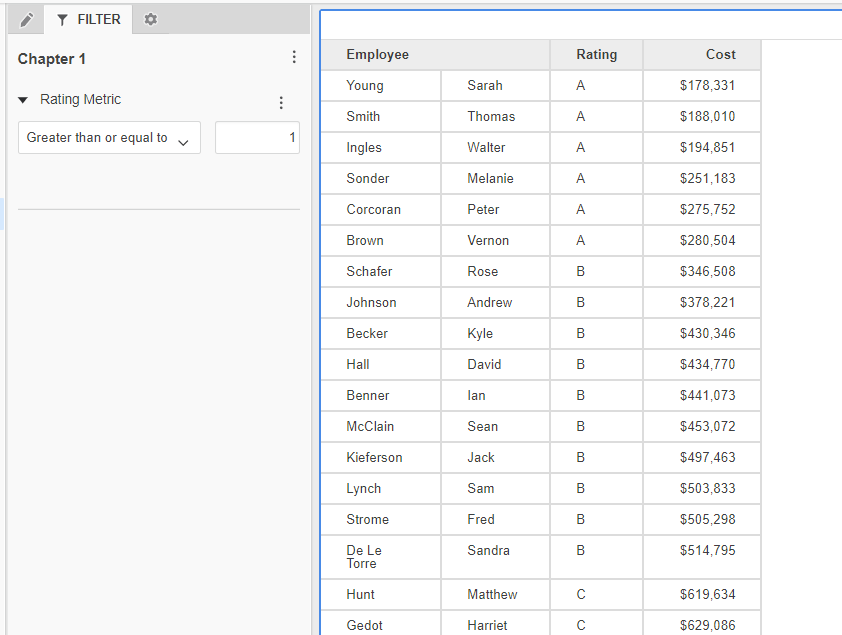
Note: This assignment is dynamic, meaning that if you change the Rating brackets in your data set the new Rating rules will be applied automatically (assuming, you are using a live connection to a database).
You may need to change Level of your metrics if there are more attributes in your initial data set.
Want more information? Check out the Learning Center or reach out to Strategy for learning materials!