Starting with the release of Strategy ONE (March 2024), dossiers are also known as dashboards.
We are quite used to use KML files for the typical administrative divisions at different levels: state, region, autonomous community, province, county, town, etc. Indeed this is quite useful since we can define each area with the name or value we expect to have coming with our data.
But, in this example, I like to show how we can use public ESRI información available at different online resources. In this case I go to use the resources existing in http://services1.arcgis.com/nCKYwcSONQTkPA4K/ArcGIS/rest/services. You can check for other resources that obviously could fit better to your own geographies.
Clicking on the map you could be interested in, is possible then select the specific layer you like. In my example I am selecting the map "ComunidadesAutonomas" and then the layer "Comunidades Autonomas". Here is important decide which fields are you going to use. If the match with your data will be done by the area name, then lets remember that the field "Texto" (in my example) will be defined at the configuration file we have to customise.
V.G.: In this example the field "Codigo" could be used as well to access the ESRI info. A further KS will be added related with this showing how we could have a map definition allowing use the field we need for each use. I strongly recommend access those maps using the area codes avoiding the spelling match. But, in this KS, lets understand how to use the area names.

Now we have to edit our mstrGeoShapesConfig file. Inside the "<layers>" section please insert the web address for these layers you like be used. In my example I am defining 6 custom layers. Please use id for them starting from 13, for instance; if you use 1, 2, 3... some interferences are produced with the OOTB maps. My example has three layers coming from the ArcGIS REST Services Directory and other three are related with local KML files.

Now, the shapes tags have to be defined accordingly the existing layers. For these layers coming from the Web Services an entry like this have to be defined. In this simple example I am using the same info for the "qf" and the "ea". This is the place to define if we like to have access as well to other fields, but let bypass this option in this example.
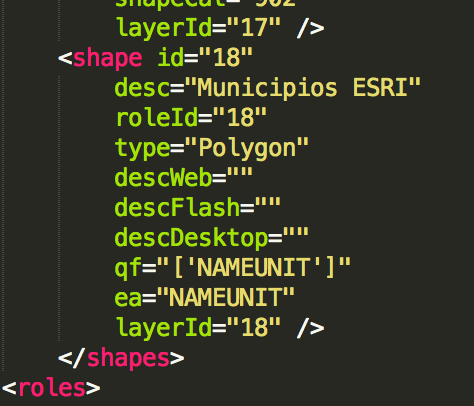
Attached with this article is the resulting mstrGeoShapesConfig with the six maps defined. Now, when inserting a map visualisation in a Dossier, the available maps are those, with the new six maps available for its use.

In this example some public information has been downloaded from public sites to make possible the example be created for spanish autonomous communities, provinces and municipalities:

The mstr file is also attached as well the Excel files used for the example. KB439260
