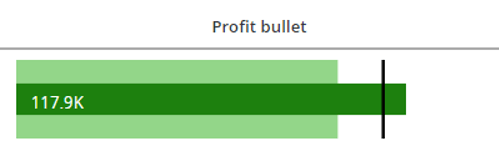
Starting with the release of Strategy ONE (March 2024), dossiers are also known as dashboards.
Strategy allows you to use many custom visualizations, like d3 and Vitara, apart from the built-in ones. Custom visualizations also support rendering HTML tags inside metrics. This feature may be used to create many new graphics that can be later placed inside a grid as a MicroChart or even a stand-alone visualization.
The following three files are attached:
If you need additional support for building new visualizations, please contact your Account Owner or Professional Services.
In Strategy 2020, when you open a dossier, you can see that there are 16 out-of-the-box visualizations. Although the number of available visualizations may seem small, they are powerful. For example, let’s take a look at our bar chart. While it may seem like it is one limited bar chart, you can take advantage of the multiple offerings within the one bar chart option. With our bar chart option, you can create variations of the bar graph, just as PowerBI or Tableau. Strategy believes ‘Less is more’ – it may appear that only 16 visualizations are available, but the possibilities with our offering are endless.
In an ideal situation, every visualization would be an OOTB one. Unfortunately, it is not possible, and we need a solution when standard charts are not enough. That’s why Strategy gives an option to create custom visualizations and then load them onto a dossier. The best ones can be viewed here in the ‘Custom Visualizations’ dossier. The following are some that ready for your use:
It is not always possible to achieve your desired visualization with only the built-in ones. Custom visualizations, such as Vitara and d3, can also lack the possibility to be adjusted. However, creating charts with SVG metrics offers flexibility. SVG metrics are shapes, like rectangles or circles, that are text coded. Traditionally, SVG metrics require programming to be created, making them not as common or convenient to use. This article, along with the attached files, present a way to use SVG metrics without any programming knowledge. This is a great way to meet specific and advanced customer expectations.
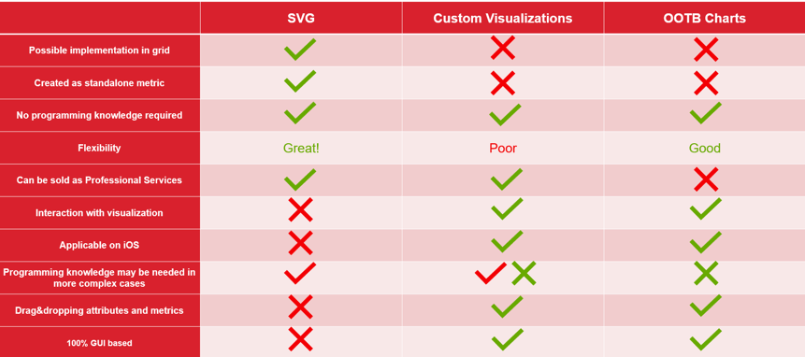
As previously mentioned, creating visualizations using SVG has its advantages and at times, disadvantages. See the following table to learn the different behaviors across OOTB, vustom visualizations, and SVG metrics.
In the attached Excel file, there are many charts readily available for you. The following example shows you how to use it. More details can be found in the documentation and Excel file. To create the visualization, you need three metrics. Often times, the Bullet Chart is used to show value versus Last Year and Target. In this case, you want to present profit metric as a Bullet Chart. You can go to Excel file and see the following:
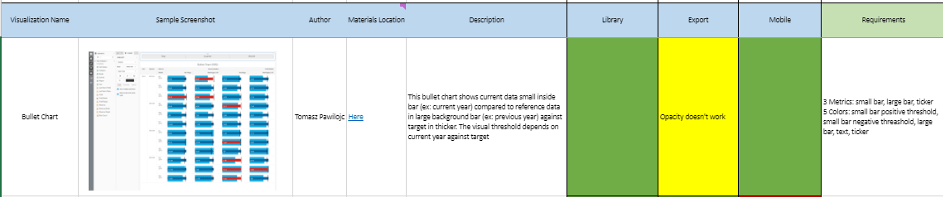
These are some basic information about metric, along with requirements. The provided information will help you understand what you need to use the visualization. Now look at the Formula column, which describes the code:
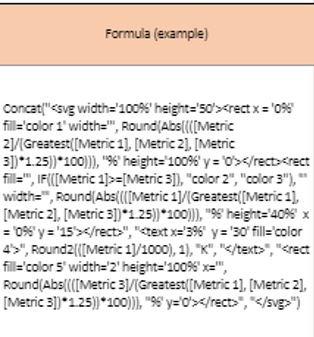
You can skip the Formula column if you want, as it is not required to be able to use the visualization. However, it may be useful to understand the code to make changes in the future. Here is the next column set:
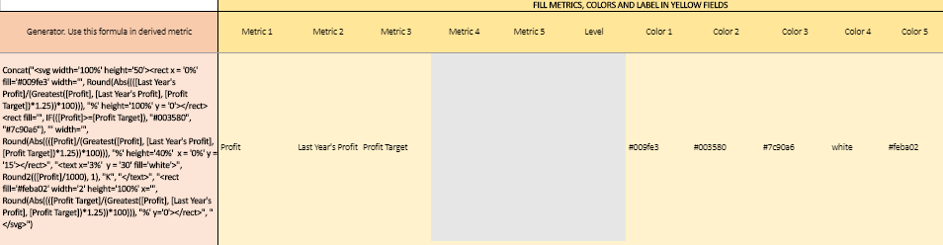
The above column set is the most important place when you want to use metrics. The yellow columns are required fields and must be completed. In this case, there are three metrics and five colors, which can be written as the name or hexagonal code. After entering all the names and selecting the colors, you must copy the field in the Generator column and paste it in the Metric Editor of your dossier.
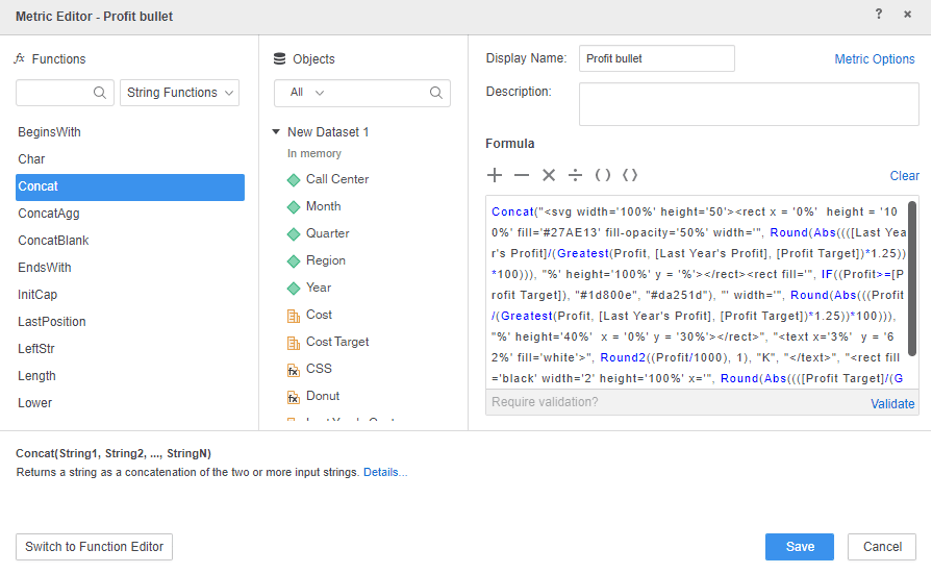
Lastly, you must drag and drop the created metric to the grid. You can also add attributes, for example, to show Profit by Call Center. You get the following results: