Starting with the release of Strategy ONE (March 2024), dossiers are also known as dashboards.
SYMPTOM:
In Strategy 10.x, exporting D3 Graphs from Documents/Visual insight to PDF changes to grid as shown below:
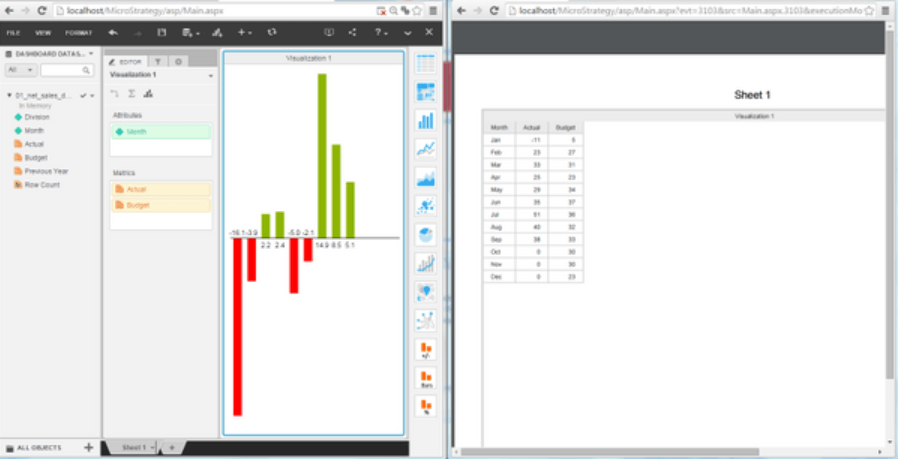
CAUSE:
Currently, export D3 to PDF only available in Dossier.
ACTION:
Strategy will continue to investigate and post updates as soon as they are available.
WORKAROUND:
1. Open Web VI using Chrome or Safari. (Latest version preferred)
2. Pick any VI dashboard, open it.
3. Hit FILE -- > Print… (It should automatically hide the dataset panel, vis gallery, toolbar, menubar, tab bar and editor panel that causing distraction, then open the print dialogue)
4. Make sure the Destination is “Save as PDF”, make sure having Background graphics checked, change Layout and Paper size to fit the dashboard into the paper if needed. (Safari has different printing dialogue but the logic is the same.)
5. Save the pdf, when the printing dialogue disappear, we will automatically bring your dashboard into original state (with toolbar, vis gallery and so on).
Several notes:
1. The option is available from VI dashboard->File->Print. We can export the whole dashboard into pdf, including OOTB visualization, Google/ESRI map and other 3rd party visualizations.
2. Currently it is only available om VI dashboard from Web, not available yet on Desktop.
3. Currently it is not available for Report Server Document.
4. It only works on browser Chrome and Safari( on Mac OS).
Article Reference Number: KB440766.
