Starting with the release of Strategy ONE (March 2024), dossiers are also known as dashboards.
Troubleshooting
Filtering a Set of Elements by a Smaller Subset Built with a Complex Filter
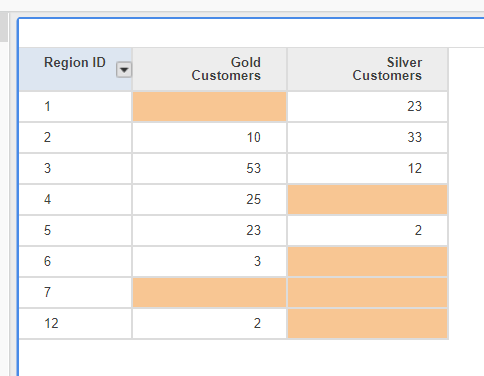
Imagine you have a report showing Revenue per Region. Within each Region you have Gold Customers and Silver customers, though in some Regions you don't have both. You want to be able to filter any visualization in your Dashboard in such a way that only Regions with both Gold customers AND with Silver customers are displayed. In other words, you want to create a set of elements based on some conditions and you use this set for filtering other visualizations.
To accomplish this, you can use Strategy's grouping feature.
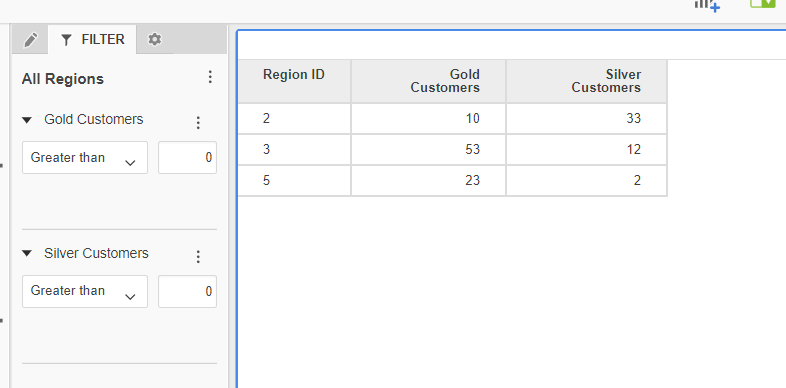
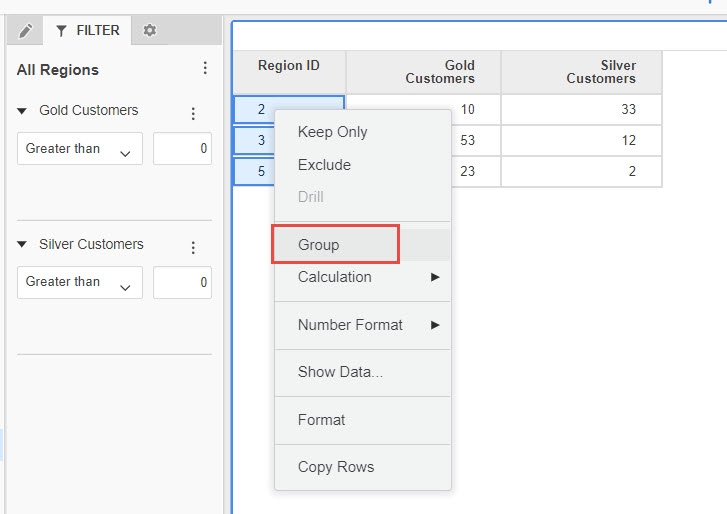
See the image below to get started with the process.
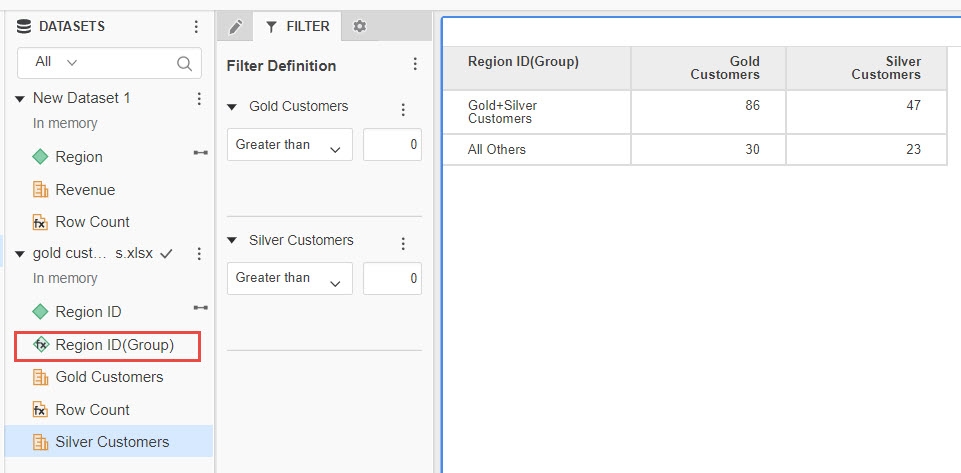
Get started with using the grouping feature
With that you receive a list of Regions that have both Gold and Silver Customers.
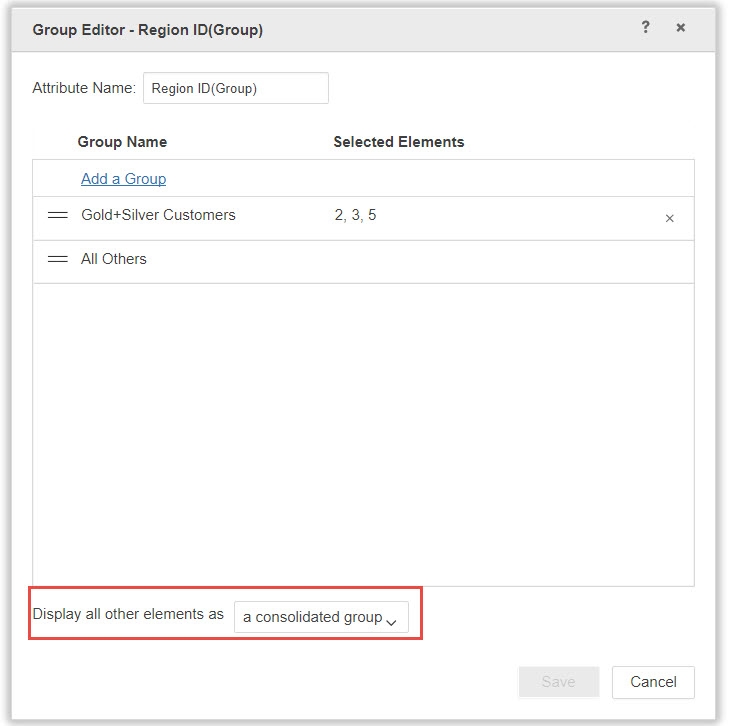
The new Group (Region ID - Group) is visible within the Dataset Pane.
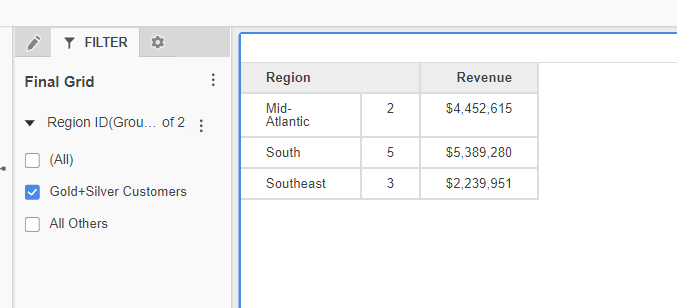
View the image below to see the group.
That's it! All visualizations within this chapter will now be filtered by your group.
Note: Remember that selections within your group are static. You will need to manually update it each time your data changes.
Make sure to view the attached files: MSTR file (dossier) and Excel file (Gold & Silver Customers).
If you have any other questions, feel free to comment on this article or start a discussion!