Starting with the release of Strategy ONE (March 2024), dossiers are also known as dashboards.
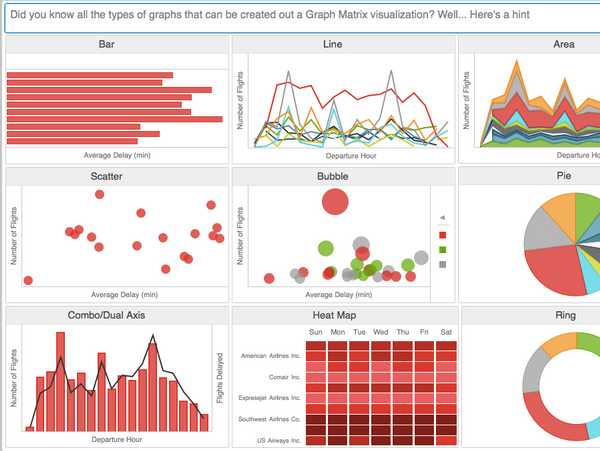
This dashboard was built to help users explore and discover all the visualizations that Strategy can build from this graph matrix dashboard. This dashboard includes a variety of different visualizations such as the Bar chart, Line graph, Area chart, and Bubble chart put together to showcase a story with data.
View the image below for reference:
Interested in learning more about Documents or Dossier authoring? Visit the Learning Center on Community!
Or go to our Documentation pages for more product information.
