Starting with the release of Strategy ONE (March 2024), dossiers are also known as dashboards.
Starting in Strategy 2021 Update 5, there is an new out-of-the-box, feature-rich, Gauge visualization. We highly recommend using this visualization instead. It is located in the More section of the Visualization Gallery.
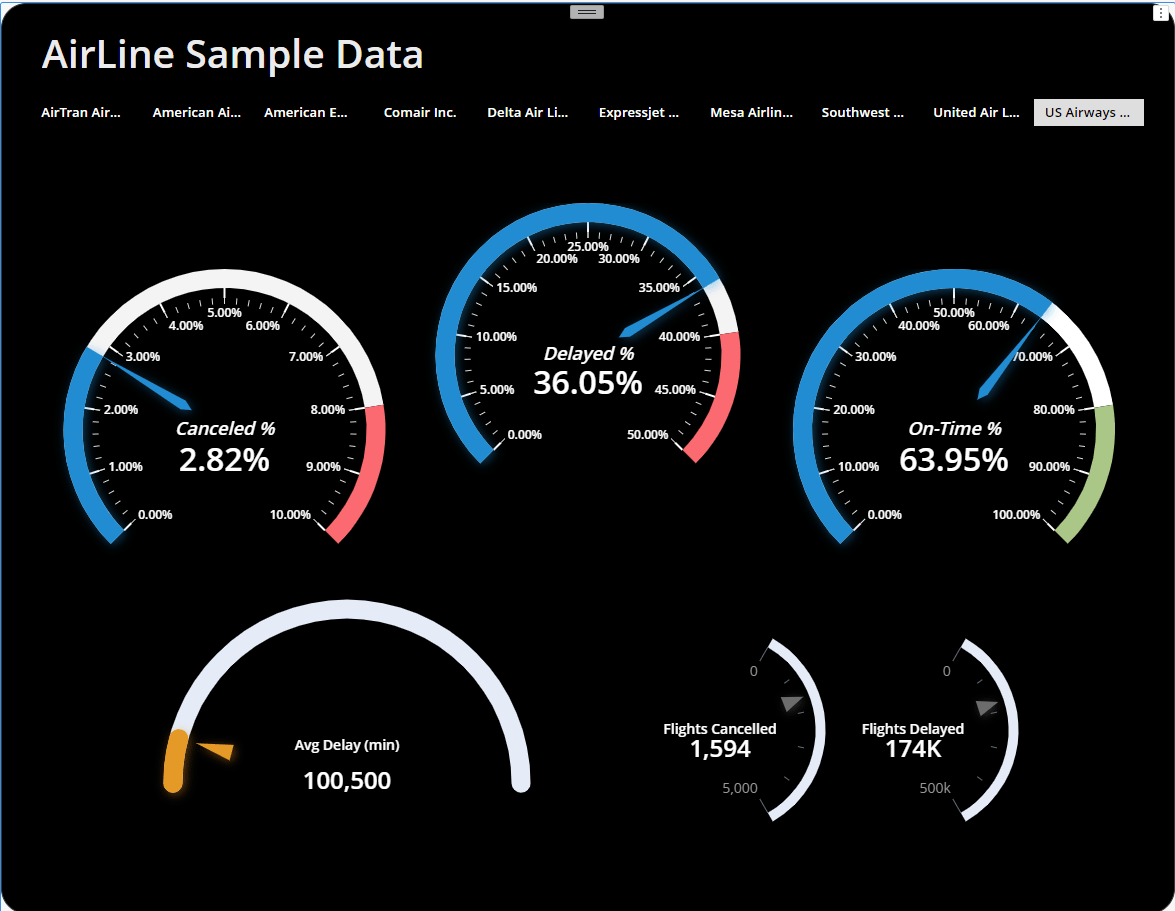
Gauge chart for Strategy Dossier
You can easily create gauge chart using metrics and format it as you want.
This visualization is free to use.
If you found an issue with the widget , please comment on this page.
Basic Usage
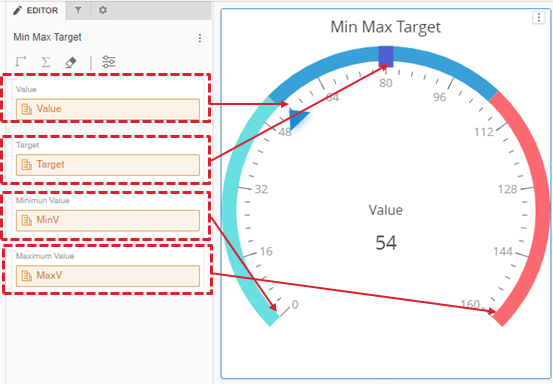
Just drag 1 metric to Value then it will show you gauge chart.
It also supports 4 metrics ,
Value will show gauge point and progress,
Target will show target point ,
Min and Max value for setting start and end point of gauge .
Please refer attached mstr file ( This sample dossier is built in 2021 update 2 environment. Please open it with latest Workstation )
Gauge Style and format
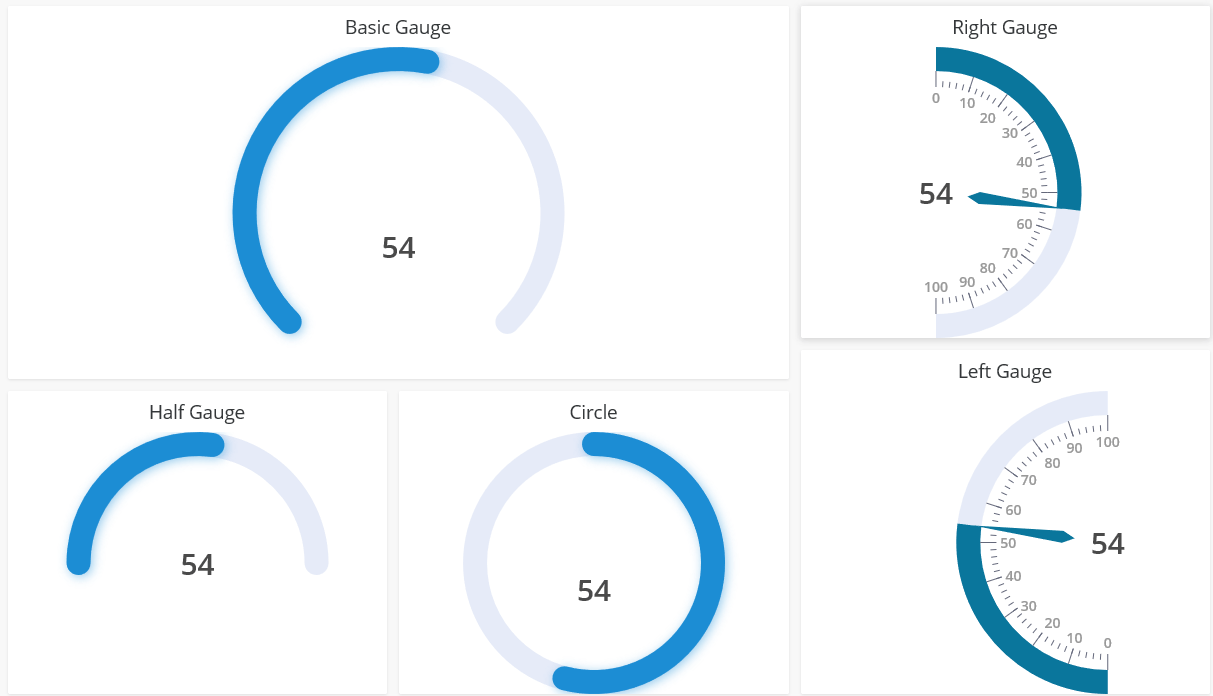
It supports several options for various gauge style
Predefined Styles
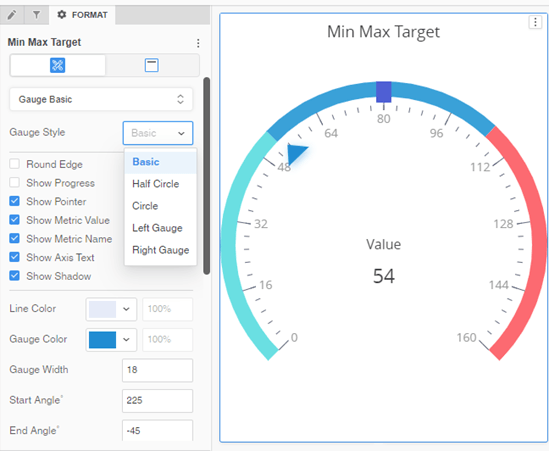
Format options
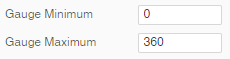
Minimum and Maximum :
You can set default value of min and max in format tab.
Start Angle and End Angle : Decide where to start and end drawing gauge.
0 degree or 360 degree of gauge is right side and add degrees to anti-clockwise direction.
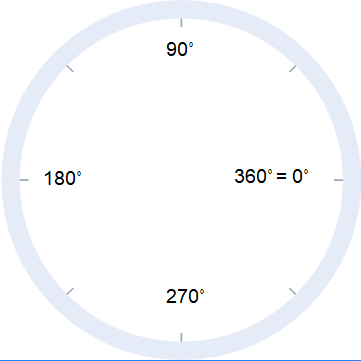
for example, start angle :180 and end angle : 0 will show half gauge.
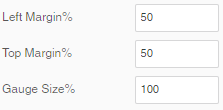
Size and Margin
Margin will move gauge center point vertically or horizontally. Gauge size will shrink or magnify the gauge. This is percentage value to widget size.
This option is useful when your gauge has small portion of circle like below picture .
It just draws gauge from 90 degree to 0 degree and a lot of space is empty.
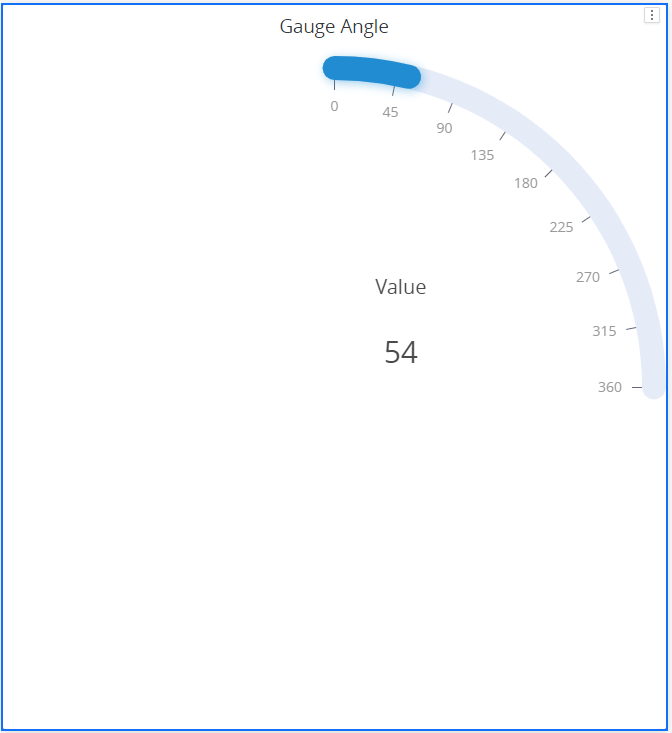
You can move center by setting margin %
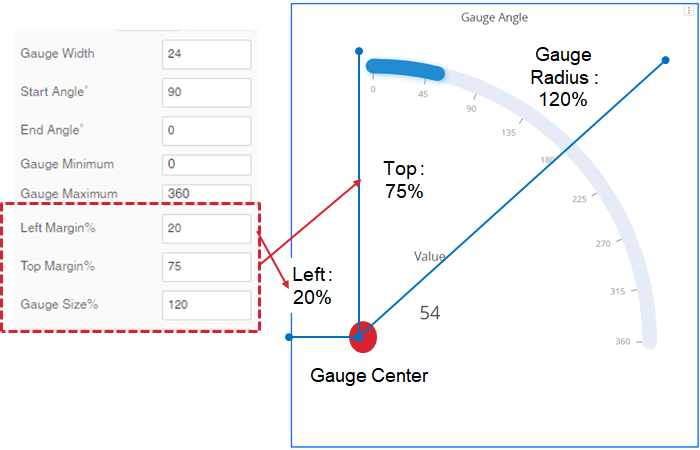
Above setting will move center 20% left and 75% from top and magnify gauge 120% from original size.
* Default gauge center is 50% left and 50% from top and radius is 100%.
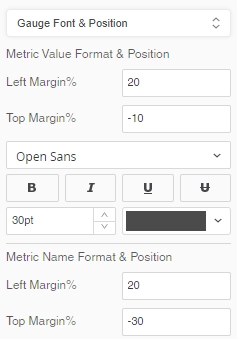
You can move metric value and name by setting margin of the font in Gauge font and Position tab. Same rule will be applied.
Gauge Threshold
In Gauge detail tab, You can enable threshold color by percent of gauge min max.
If you want to set color of bottom 20% is blue and top 20% is red , set threshold like below ,
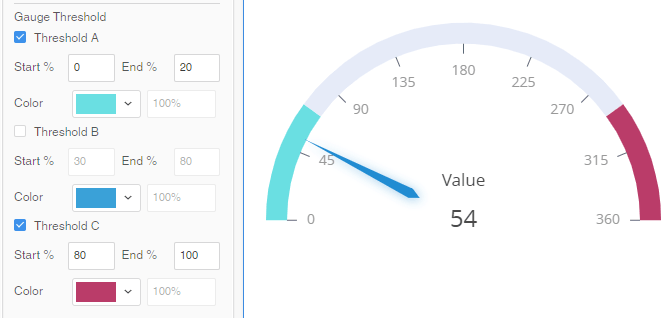
There is known issue that if you type into value in the threshold field , threshold is sometimes missing depends on the value is overlapped other threshold. When this happen, reset other values will resolve the issue.
Object requirements:
·At least 1 Metrics
Minimum Strategy version: 2020
Current visualization version: 1.0
Publisher: DongHyub Lee ( Sales Engineer in Strategy Korea)
Strategy Features
Supports custom properties
PDF Export
Installation instructions
• To install this visualization, download the .zip file below and deploy it in Strategy Workstation or Strategy Web.
• After you have installed the visualization, you can open a working demo of this visualization by uploading the .mstr file below and doing the following:
o To open the demo visualization in Strategy Desktop or Workstation, double click the .mstr file.
o To open the demo visualization in Strategy Web, choose Create -> Upload Strategy File -> View Dashboard
Visualization Disclaimer
By downloading or using this visualization, you accept and acknowledge these terms.
This visualization is both intended as sample code and provided as a convenience to Strategy users. Strategy cannot guarantee that the code provided will apply to any Strategy releases and clients outside of the versions stated within this article. This sample is supported by Strategy Technical Support up to and including the basic visualization functionality listed in this article. Defects will be triaged by the Strategy team as they are raised. For users with active Strategy Technical Support contracts, contact Strategy Technical Support to raise these defects.
Open Source
eCharts (https://echarts.apache.org/en/index.html) library is included in the widget code