Starting with the release of Strategy ONE (March 2024), dossiers are also known as dashboards.
A heat map visualization is a combination of colored rectangles, each representing an attribute element. It allows you to quickly grasp the state and impact of a large number of variables at one time. This type of data visualization contains individual values in a matrix. Heat Map was originally introduced by a software designer, Cormac Kinney in the year 1991. It was used to depict real time financial market information.
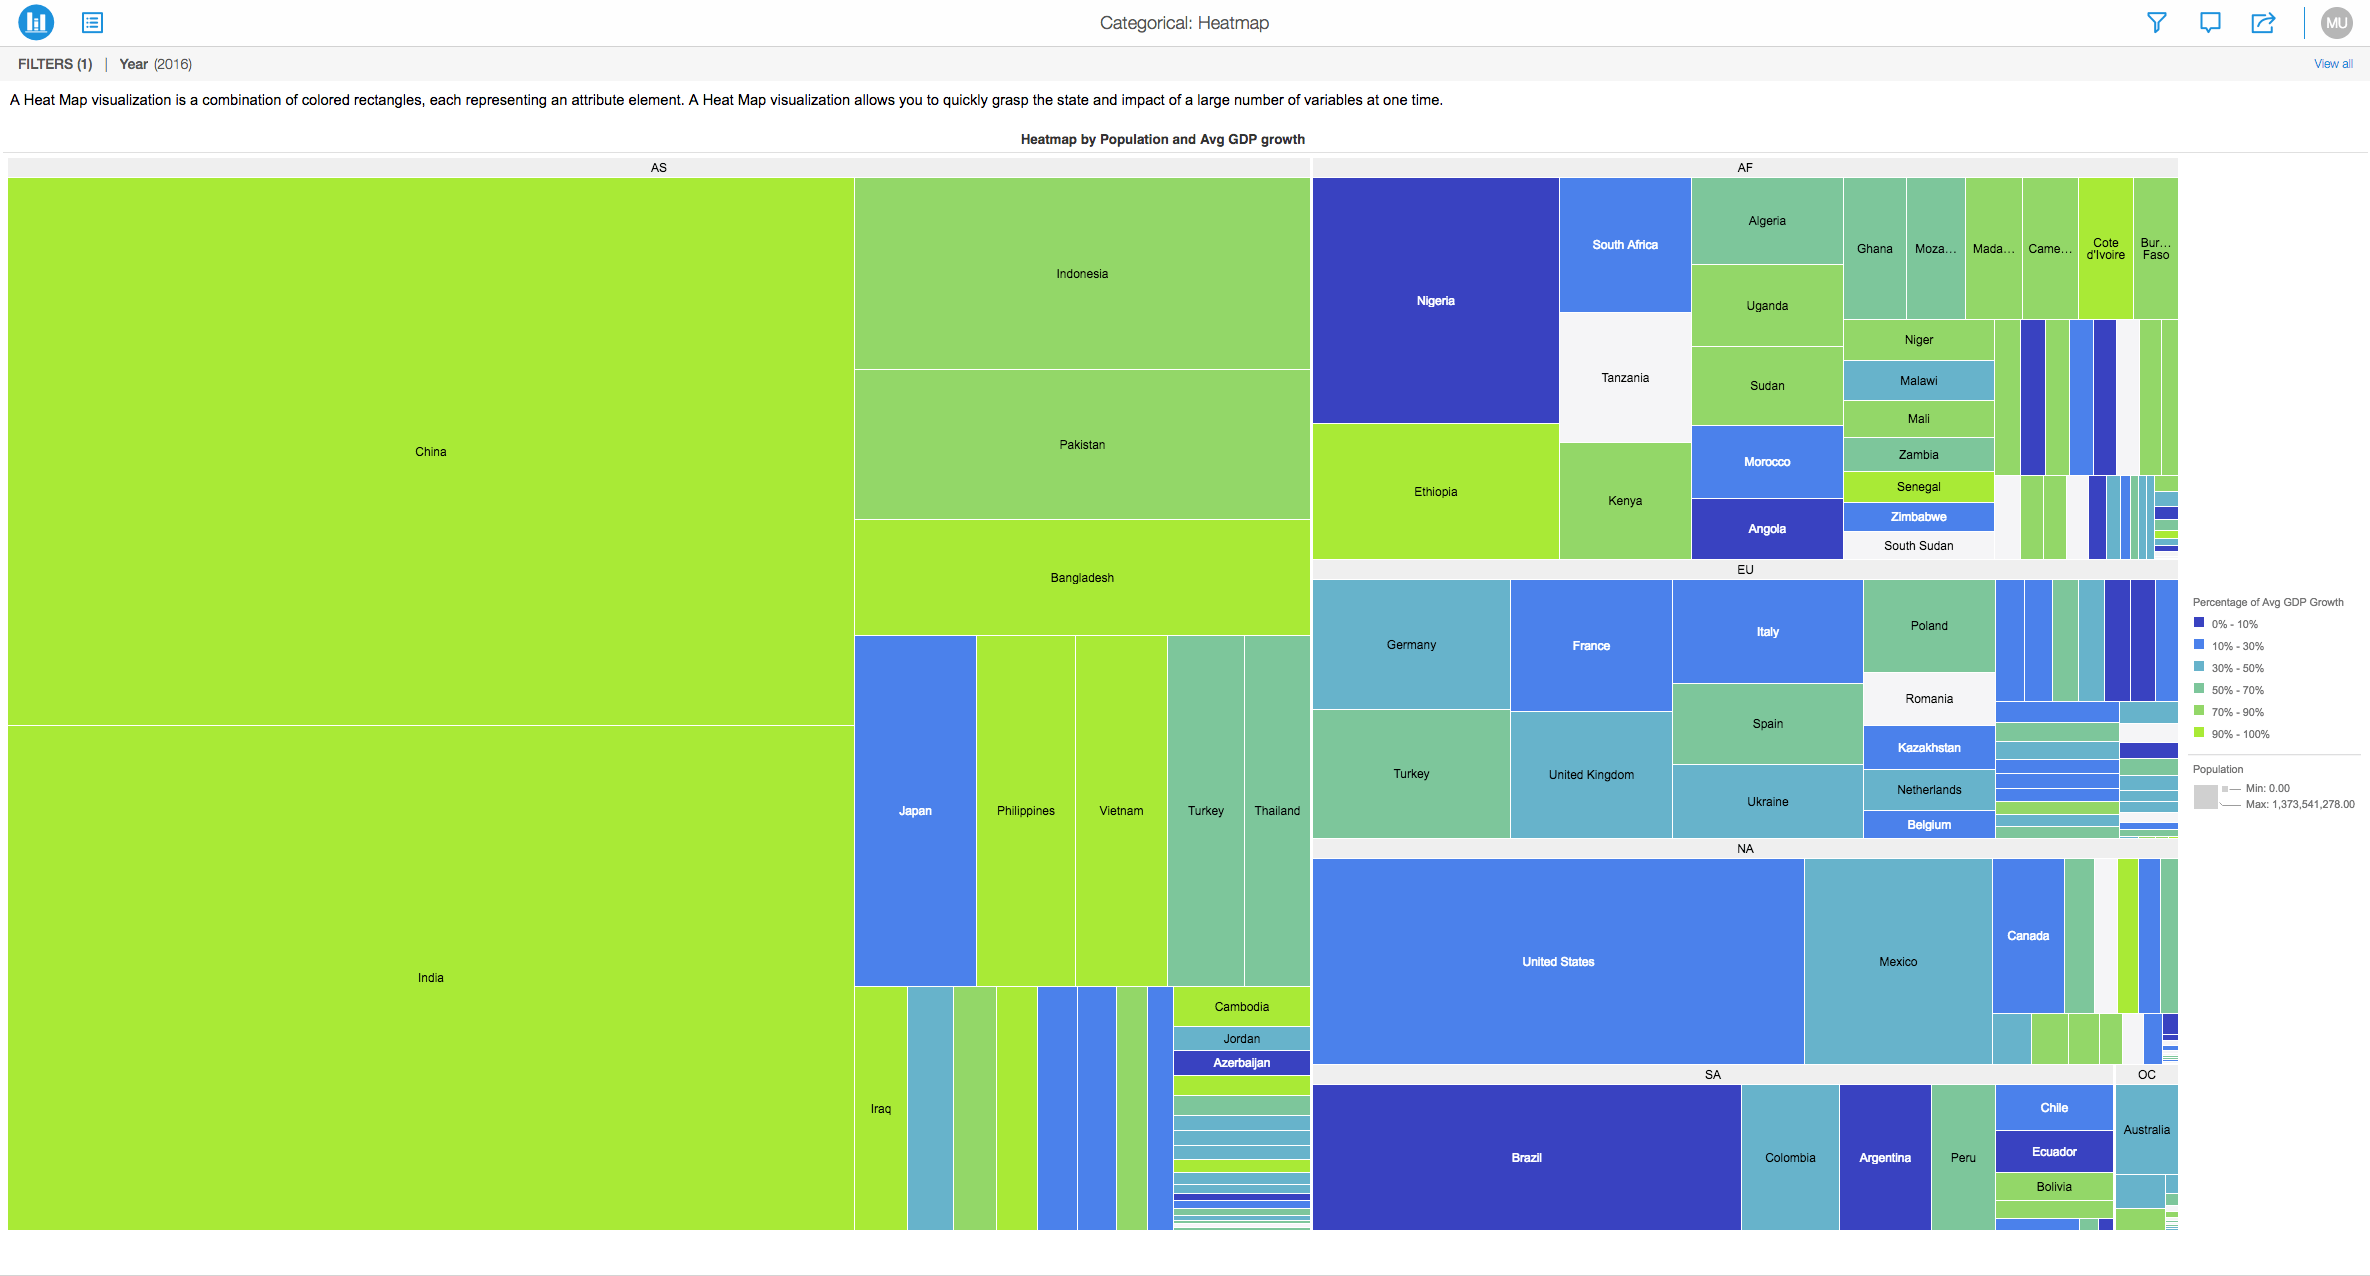
Here is a heat map which compares population in different countries around the world and the color of each box is dependent on the Average GDP Growth in these countries.
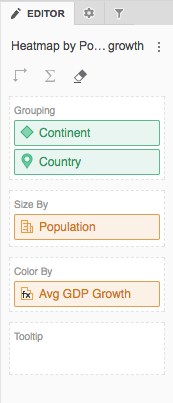
Below, you can get an idea on how the attributes and metrics were placed to generate this type of a heat map.
Requirements:
Minimum Strategy version: 10.2
Publisher: Strategy
Installation Instructions:
Analyze using heat map by downloading MicroStrategy Desktop!
References:
A project in beta by ferdio, (2017, December 4th). Retrieved from http://datavizproject.com/
