Starting with the release of Strategy ONE (March 2024), dossiers are also known as dashboards.
With Strategy, users can use histogram charts to show the frequency of values within given metric ranges.
This article will preview an example from the Sports industry to show how histograms can add value to analysis.
Minimum Strategy version: 10.11
Publisher: Strategy
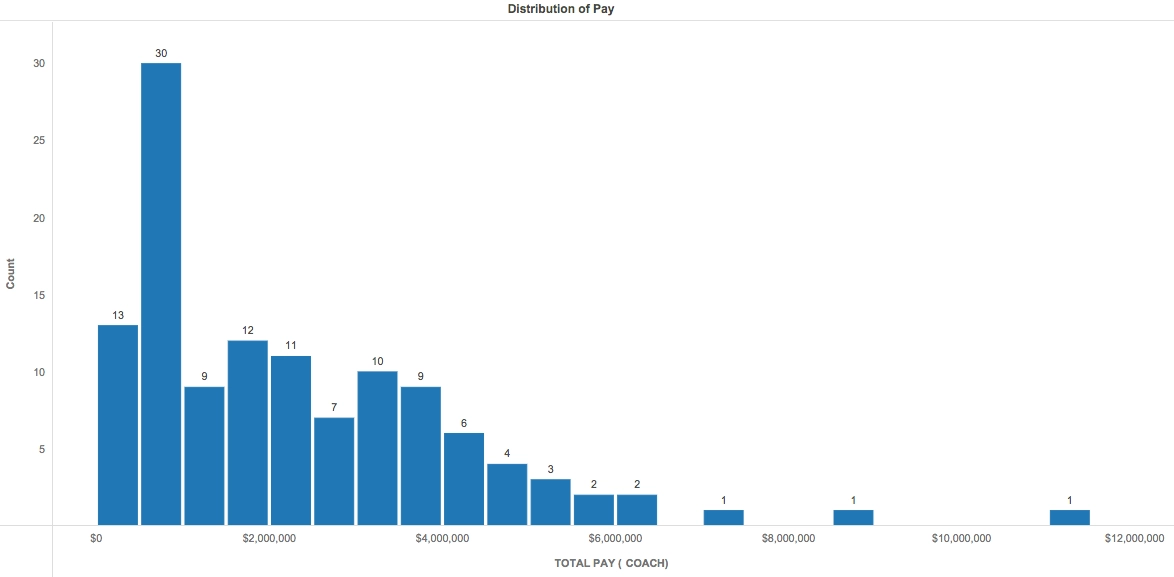
A Histogram visualization uses a bar graph format to group frequencies of data values together. The height of each bar represents the number of data points that fall into a given interval, while the label of the bar indicates the associated range of values. The overall shape of the Histogram, often some sort of bell curve, provides insight into the distribution of the dataset: whether it is evenly distributed, whether it is left- or right-skewed, and where it has any outliers. The main purpose of a Histogram is to illustrate a distribution, so they often work best with larger sets of data.
In this example, we analyzed the salaries for 121 head college football coaches in the NCAA. A Histogram works well here because we want to group ranges of a metric (pay) by a given attribute (coach). The pay ranges for the coaches are on the x-axis, while the number of coaches in each pay range is on the y-axis. Note the inclusion of data labels to make the Histogram easy to read. Additionally, the inclusion of "Filter by Conference" allows the user to gain more specific insight into the pay distribution within different NCAA conferences.
We can quickly draw a few conclusions from this Histogram: for example, our eye is immediately drawn to the tallest bar, which tells us that nearly a third of coaches in this sample make between $500K and $1M. From the size of the next tallest bars, we can also see that a significant portion of coaches make between $1M and $4M. There are a few outliers on the higher end of the data, indicating a right or positive skew. Analyzing these outliers shows us that the highest paid coach makes over $11M a year.
Histograms are a helpful way of determining the distribution of data points, and can often help identify abnormalities and outliers. They help to answer questions about where the majority or minority of data points lie; with this information, businesses can make informed decisions about relevant processes and procedures that either (1) take advantage of an existing distribution or (2) may be improved to make a distribution more favorable to the stakeholders.
http://sports.usatoday.com/ncaa/salaries/football/coach
Analyze using histograms by downloading MicroStrategy Desktop!
Feel free to download the .mstr file attached to the article to view the "Histogram Example NCAAF Salaries" dossier.
Interested in learning more about Dossier authoring? Visit the Learning Center on Community!
