EducationSoftwareStrategy.com
StrategyCommunity

Knowledge Base

Product

Community

Knowledge Base

TopicsBrowse ArticlesDeveloper Zone

Product

Download SoftwareProduct DocumentationSecurity Hub

Education

Tutorial VideosSolution GalleryEducation courses

Community

GuidelinesGrandmastersEvents
x_social-icon_white.svglinkedin_social-icon_white.svg
Strategy logoCommunity

© Strategy Inc. All Rights Reserved.

LegalTerms of UsePrivacy Policy
  1. Home
  2. Topics
  3. Honeycomb Visualization by Vitara

Honeycomb Visualization by Vitara


Community Admin

Placeholder •


Vitarachart's Honeycomb visualization displays high-density views that allow you to uncover hotspots and dive deeper into metrics. Discover server resource availability for departments and timeframes with vibrant, grouped clusters. Elevate your data game with a buzz-worthy visualization!

Starting with the release of Strategy ONE (March 2024), dossiers are also known as dashboards.

ka0PW0000001JlXYAU_0EM4W000005acD5.jpeg

Strategy Features

  • Fully customizable with editors in Dossier or Web Report Services Documents (DHTML widgets) for appearance
  • Compatible with all supported versions of Strategy Desktop, Web, Library, and Mobile

Vitaracharts is now FREE for Desktop and Workstation. 
Please contact sales@vitaracharts.com to get a 30-day trial key.
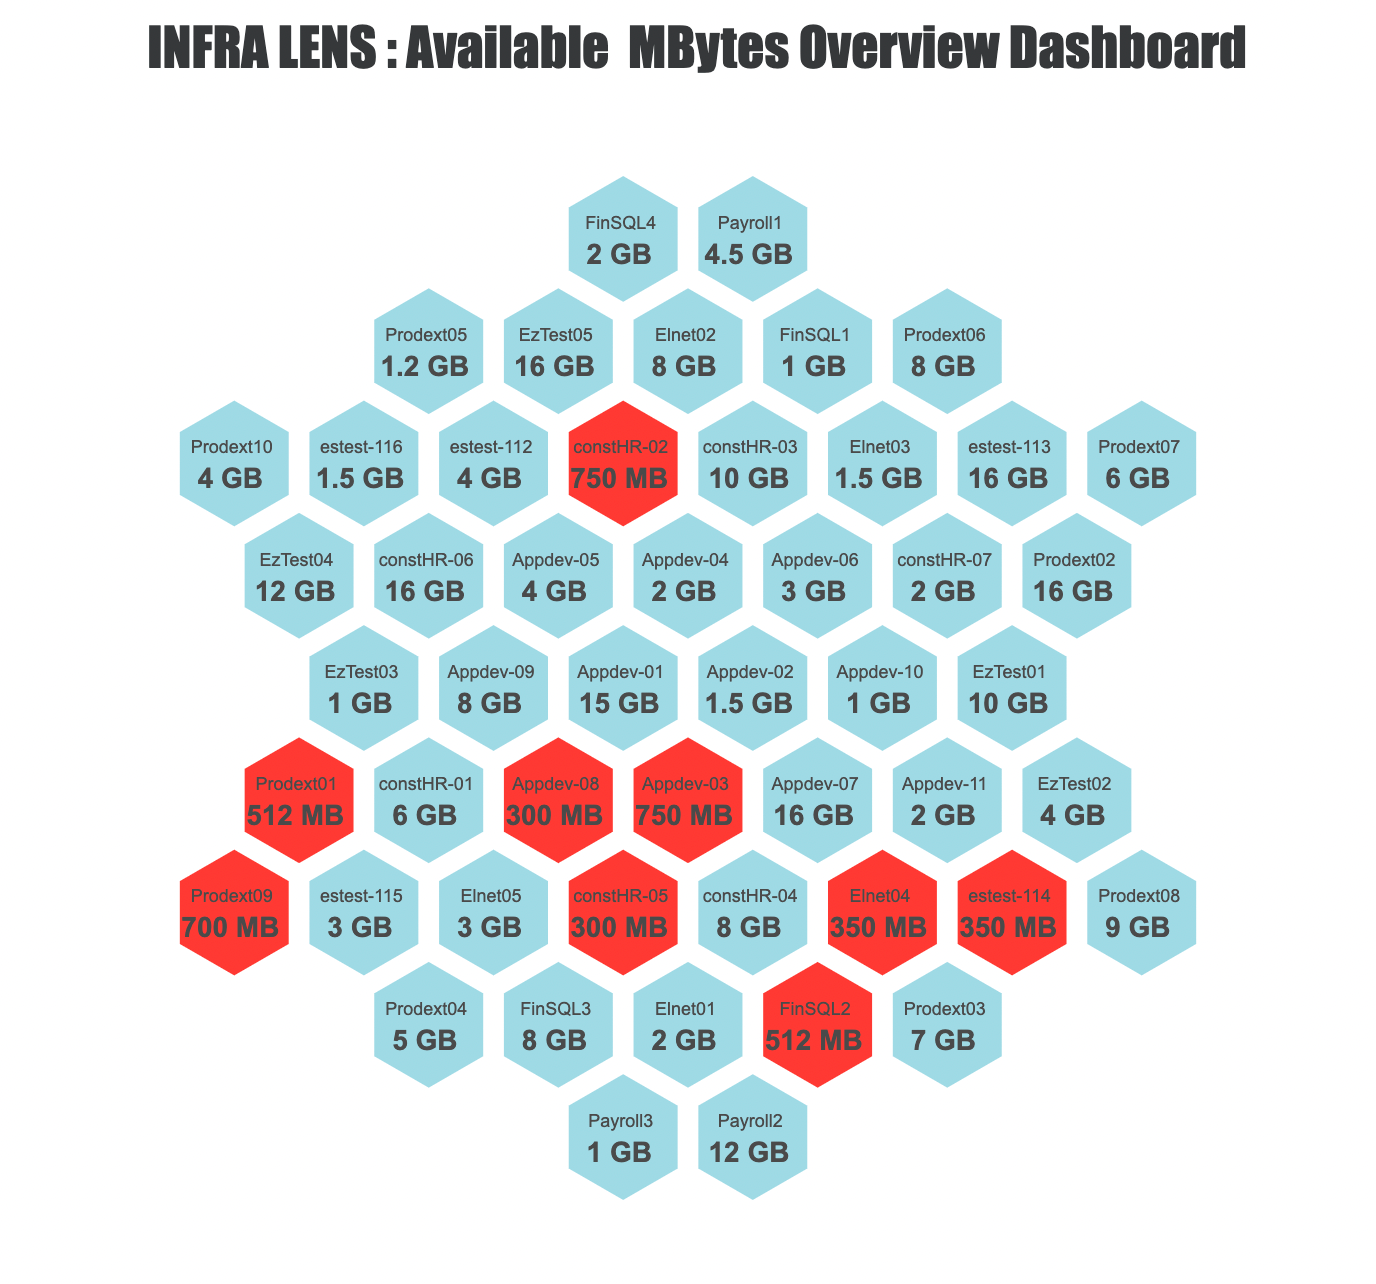
Take note that this visual is a part of the VitaraCharts library.
Download visualizations: www.vitaracharts.com
Online interactive visualizations can be accessed here: https://cloud.vitaracharts.com
Publisher: Vitara
Vitara is a Strategy technology partner with its flagship product Vitaracharts - a visualization library add-on with 30+ new chart options for Strategy Desktop, Web, Mobile, and Library. For more details and a free 30-day trial, reach www.Vitaracharts.com.


Comment

0 comments

Details

Example

Published:

July 12, 2023

Last Updated:

March 21, 2024