Starting with the release of Strategy ONE (March 2024), dossiers are also known as dashboards.
Troubleshooting
How can I filter a visualization on a dossier that users can't view of manipulate?
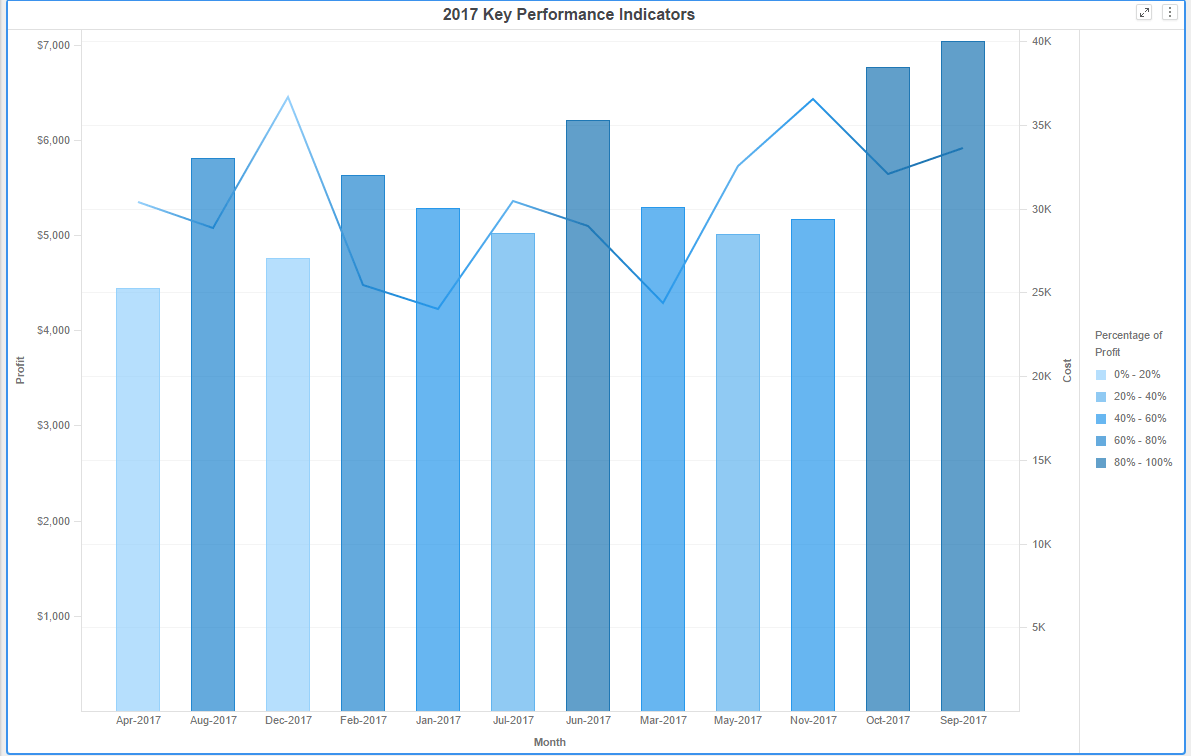
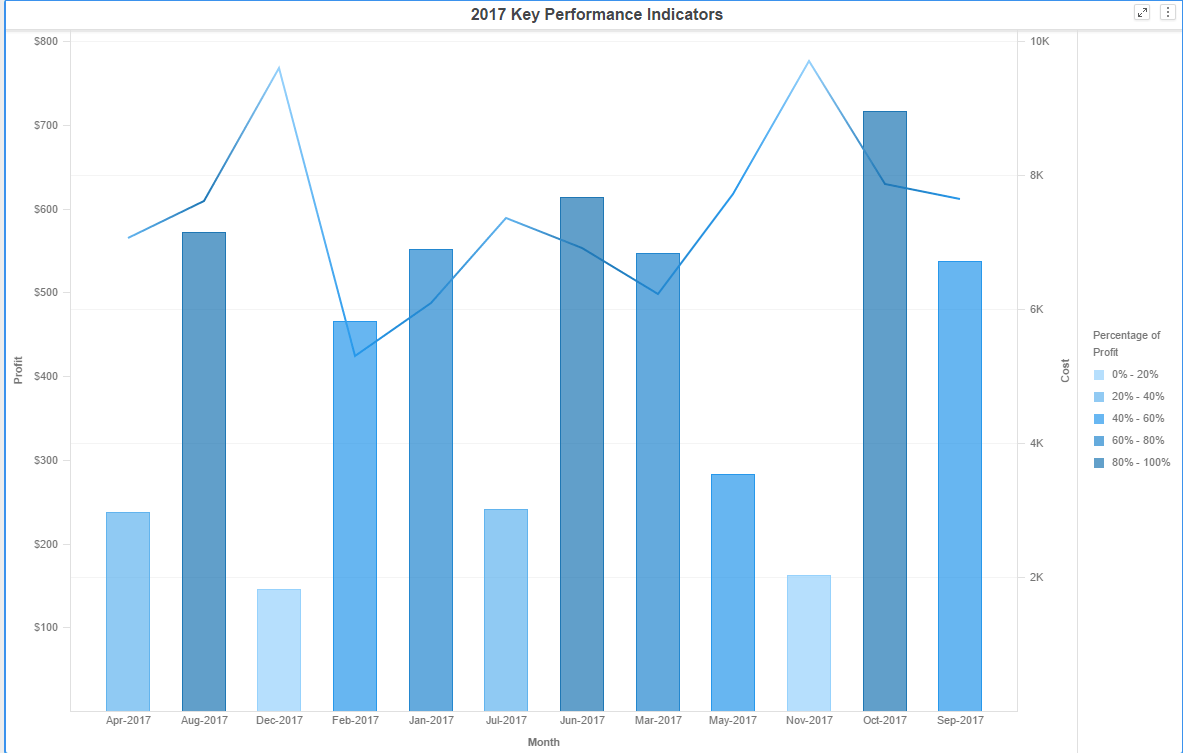
When designing dossiers, authors can leverage innovative filters to narrow the data, such as visualizations as filters and linking pages. End users can view and manipulate these filters in Strategy Library. But what if you want to narrow the data displayed without allowing end users to update filter selections? For example, in a bar graph visualization detailing quarterly profits, you only want to display quarters in 2017, but your data includes years 2010-2017. To display only 2017 in your bar graph, you can add an advanced filter to the visualization. Keep reading to learn the next steps!
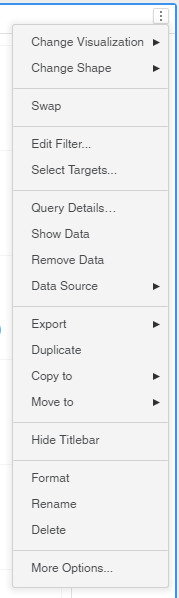
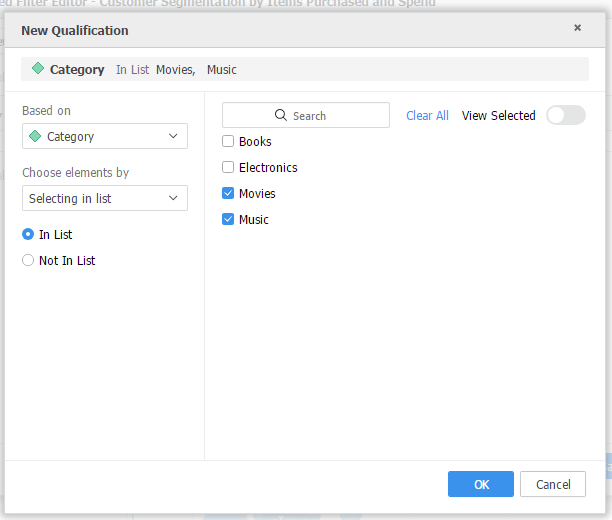
Adding an Advanced Filter
To add an advanced filter to a visualization:
What does all of this mean?
The image on the right does not have a filter, the image on the left has a selecting in list qualification applied.
You are now ready to go!
Have other questions?
Feel free to start a discussion, visit the Learning Center, or reach out to Strategy for other learning materials!