(From https://docs.microsoft.com/en-us/azure/machine-learning/ )
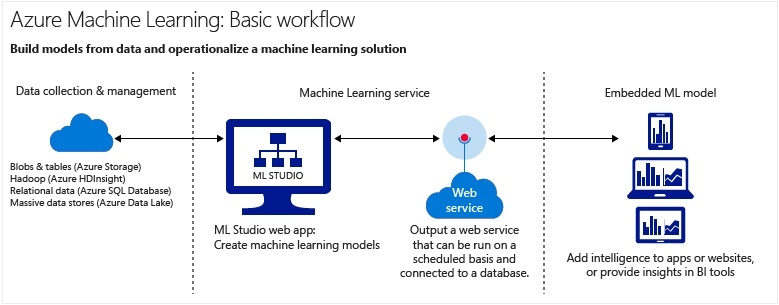
As the graph of workflow describes, after user train/optimize the predictive models and deploy the predictive models as web services, as a BI tool, we can consume the web services to provide prediction capability for new data. Following are the steps for this process.
1.Create a predictive solution in Azure
To create a predictive solution in Azure for Strategy, we need to follow these steps:
Please refer to this document (https://docs.microsoft.com/en-us/learn/paths/create-machine-learn-models/ ) to complete the steps.
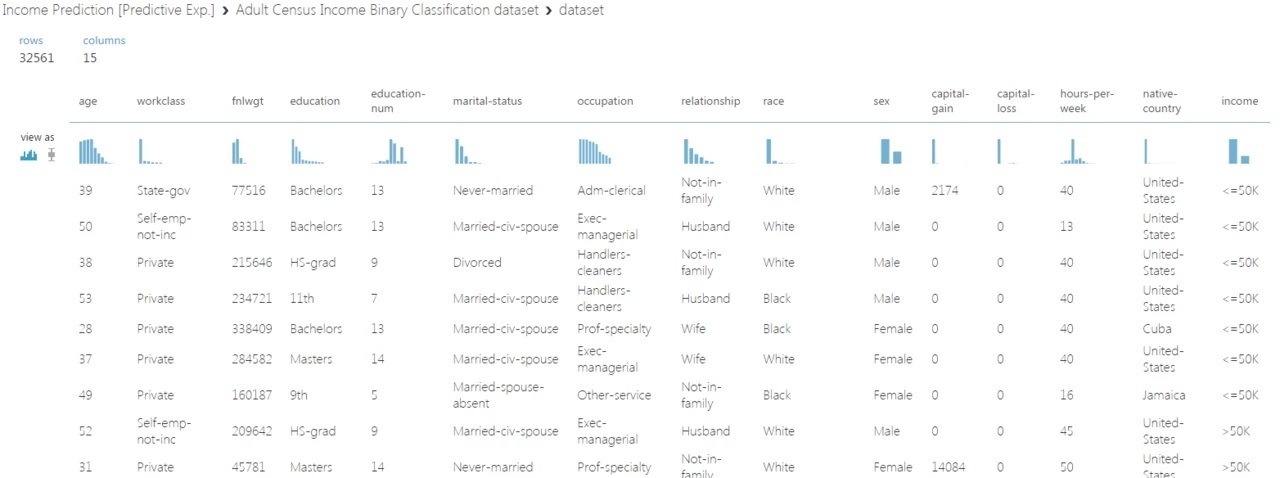
In this example, we want to predict the Income category based on features like age, education, occupation and so on, part of the training data looks like below:
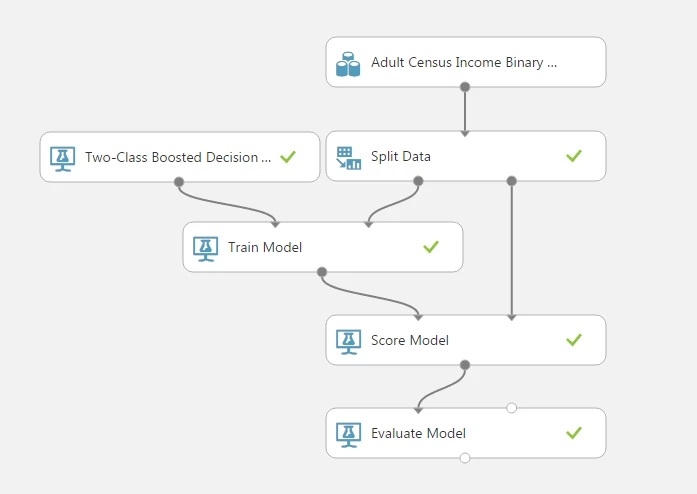
We use the Two-Class Boosted Decision Tree algorithm for the model. The training experiment is shown in below the below screenshot of the Azure Machine Learning Studio:
2.Prepare Strategy environment
In a Windows environment, Users can install Microsoft R. Users can also use CRAN to download R binary distribution corresponding to any operating system and install it.
Users can leverage Microsoft Visual Studio for R development in a Windows environment (https://www.visualstudio.com/vs/rtvs/). Users also have the option to use the free IDE R studio (https://www.rstudio.com/) for your R development as it is available for all operating systems.
On the machine you have R installed, download R Integration Pack (https://rintegrationpack.codeplex.com/releases/view/630028) for your platform, and install it.
3.Prepare R code to access web service
After you have deployed the prediction model into web service, in the Consume tab of the web service dashboard, you will find the API Key and Sample Code in R for the Request-Response mode.
You need to modify 3 places in the code to make it work in Strategy.
4.Visualize the model in Strategy
In R studio, run the following commands:
library(StrategyR)
deployR()
In the deployR editor, open your R script file, and define the input, output and other parameters. You get the metric expression on the right bottom.
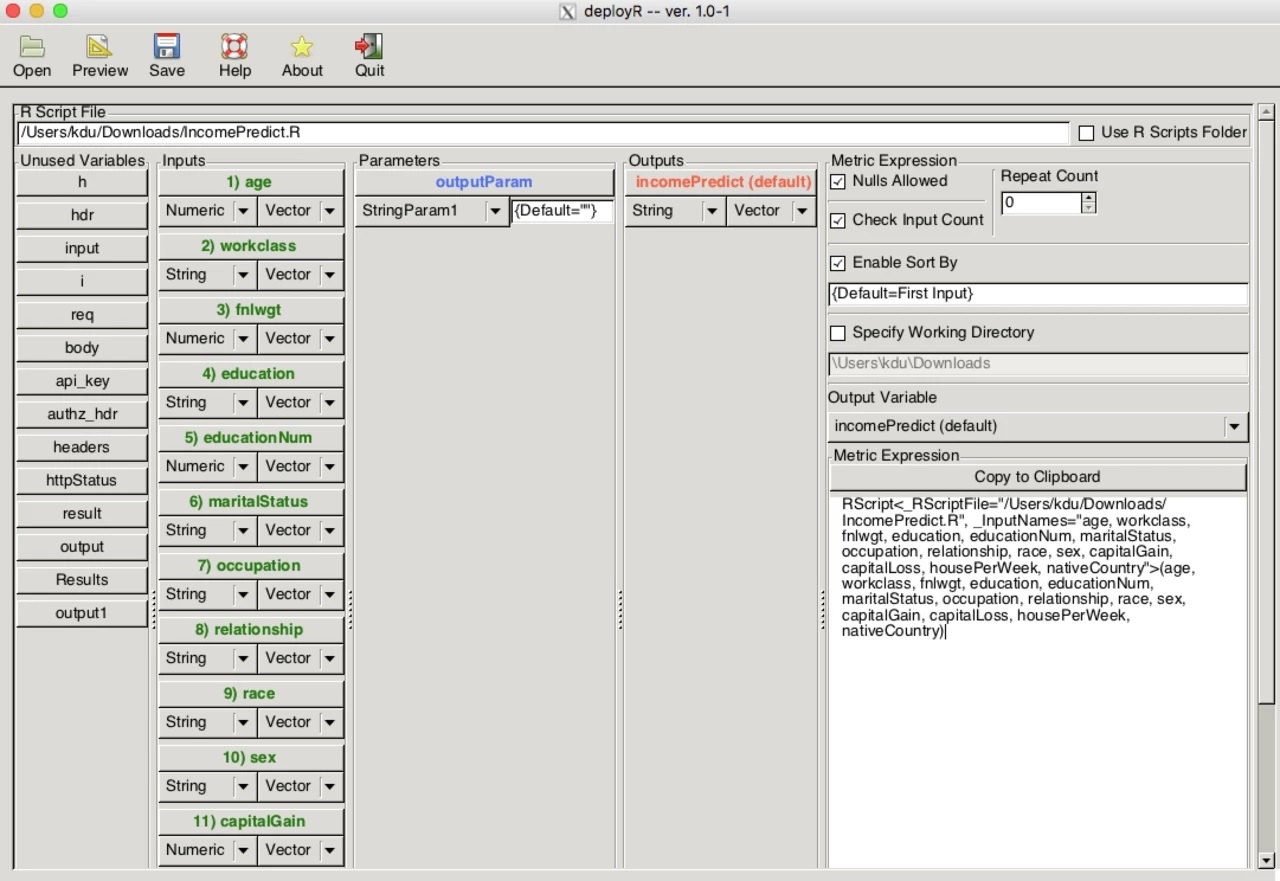
Click Save to save the final R script.
In this case, we plan to use the machine learning model to predict the yearly income for individuals based on a variety of attributes.
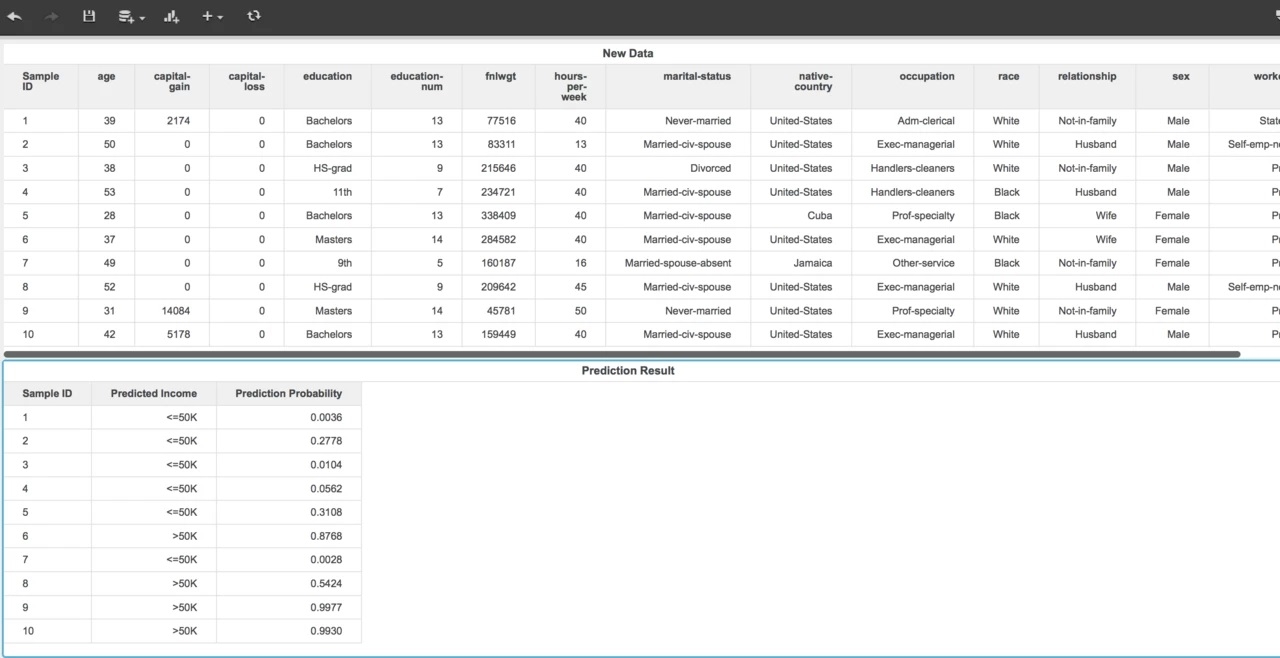
Using the above R script, we can make these predictions for new data in Strategy by creating a new metric as shown below.
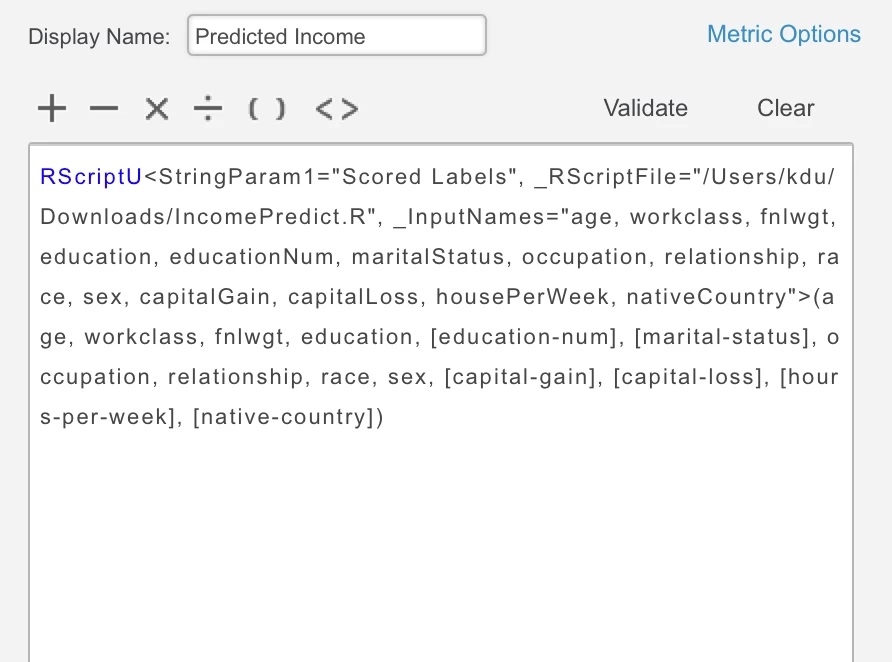
Once the metric is defined, Strategy connects to the web service that was created in Microsoft Azure ML studio to score the individual rows and provide a prediction of the income for everyone based on their individual attributes.