SYMPTOM
When using the detailed section users will notice they are not able to enable biding in the same manner as on grids as the objects entered appear only as a text box.
ACTION
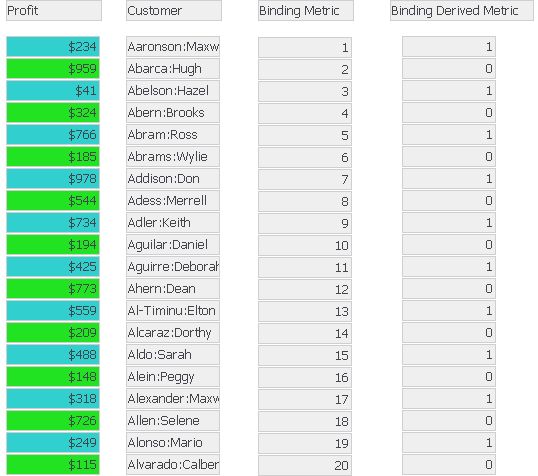
We are able to achieve this custom banding by creating a new metric and a derived metric. Below is a screenshot of our results applying custom banding to one metric (profit) and demonstrating the attribute (customer) to which it binding formatting was not applied. To achieve this we also demonstrated the two metrics created, the Binding Metric which is added to the report and the derived Metric Binding Derived Metric that was added on the document level:
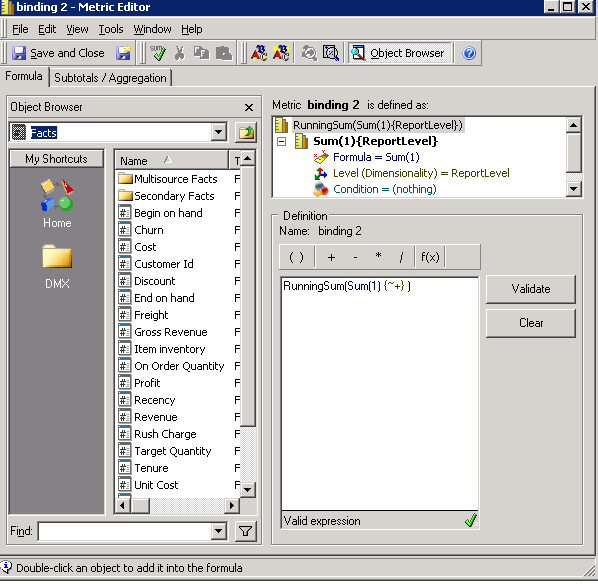
1.In the first step we creat the metric with the equation: RunningSum(Sum(1))
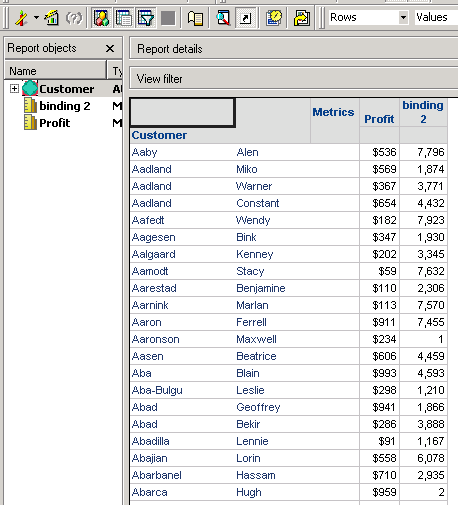
2.We then created a report in either web or developer with our new banding metric along with any desired attributes or metrics we want in our documents detailed section (we chose profit and customers from tutorial for our example)
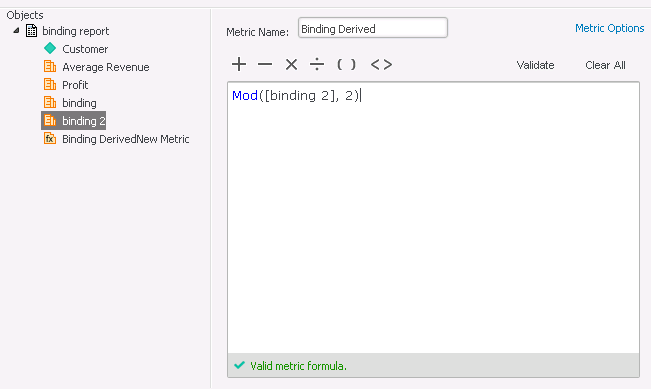
3.After creating a new document and importing the report we added the following derived metric with the formula:Mod(RSmetric, 2)
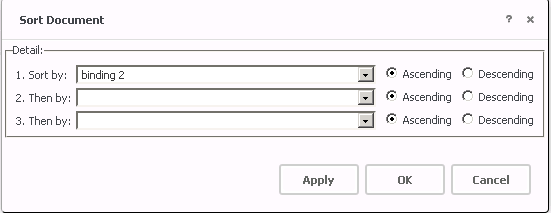
4.Then we fixed the ordering of our binding metric in the document by going in data menu then selecting sorting. More information may be found here on how to change the sorting http://www2.microstrategy.com/producthelp/10/WebUser/WebHelp/Lang_1033/Sort_Document_dialog.htm . We then chose our metric we created for binding to sort by ascending as shown below:
5.Then after adding the metric profit to the detailed section we right clicked the metric text box and selected conditional formatting->advanced. Then we created the following conditional formatting for the metric profit:
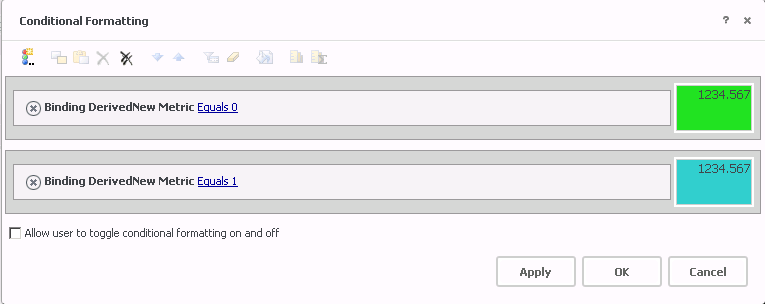
Changing the formatting and applying these conditions to all the desired metrics in the detail section will allow you achieve the custom banding desired in the detailed section.
KB439517
