In Strategy 10.x you can change the colors and overall look and feel of specific objects, such as series, on your graph. For example, you can format individual bars in your Bar graph or pie slices in your Pie chart report by adjusting colors, and applying a variety of graphical effects, including gradients.
Gradient colors blend two colors to create a gradual color change in the background of a graph or a control in a Report or Report Services document. You can select the two colors, as well as the direction of the blending. The direction is called the gradient shading style, and several variants are available within each shading style (for example, Horizontal centered is one variant of the Horizontal shading style).
To apply gradient colors to the series of a graph in Strategy Web:
1) Run a report, and display it in either Graph View or Grid and Graph View.
2) Right-click the graph to modify, select Fill, and then Gradients. The Gradients dialog box opens.
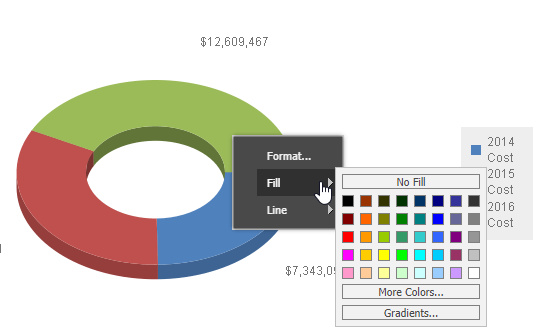
3) Select the two colors to use for the gradient from the Color 1 and Color 2 drop-down lists.
4) Click OK to apply the changes.
To apply gradient colors to the series of a graph in Strategy Developer:
1) Run a report, and display it in either Graph View or Grid and Graph View.
2) Right-click the graph > series options
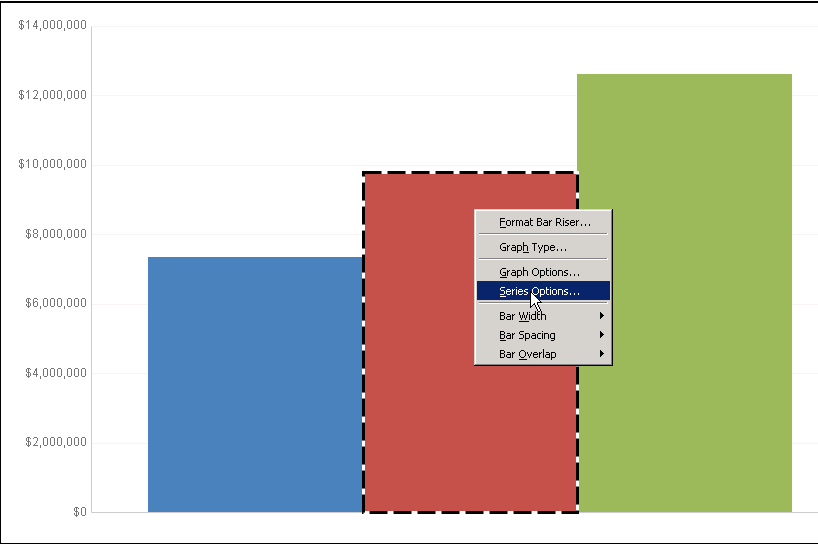
3) Expand the series element > Fill, and then Gradients from the Background type drop-down list. The Gradients dialog box opens.
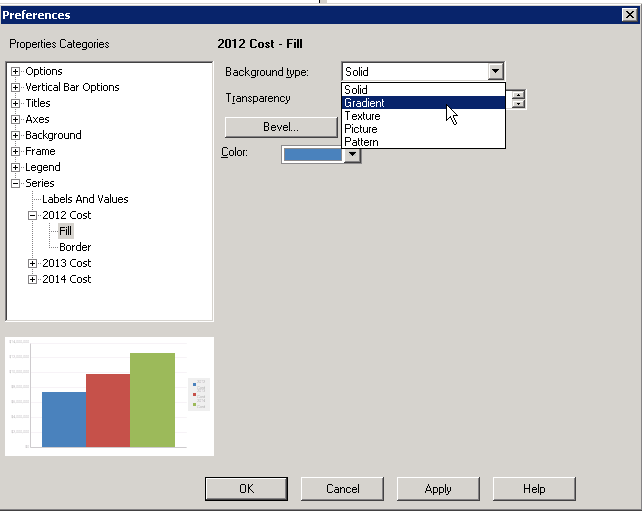
4) Select the two colors to use for the gradient from the Color 1 and Color 2 drop-down lists.
5) Click OK to apply the changes. KB440510
