DISCUSSION
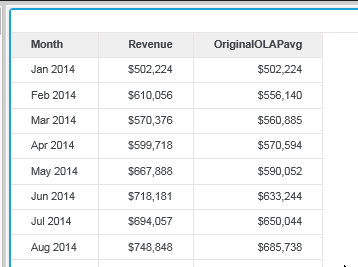
Consider a scenario where a user wants to create a derived metric containing the OLAPAvg function in a VI dashboard that will calculate the moving average starting at 4 rows before the current row and stopping at the current row. The image below shows a dashboard containing the Month attribute, Revenue metric, and the OLAPAvg derived metric.
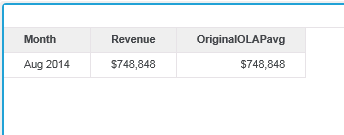
Now assume that the user adds a filter to only show the row for August 2014. Note that the OriginalOLAPAvg metric recalculates based on the rows currently displayed in the visualization as seen in the image below. Since Aug 2014 is the only row displayed the Revenue for Aug 2014 is the only value used in the calculation of the OLAPAvg metric. The rows that have been filtered out are no longer used in the calculation of the metric.
This behavior is seen because filters in a visualization are applied prior to the calculation of derived metrics. In some cases users may want to include the pre-filtered rows in the calculation of the OLAPAvg metric in which case the following steps can be used
STEPS TO CREATE THE METRIC
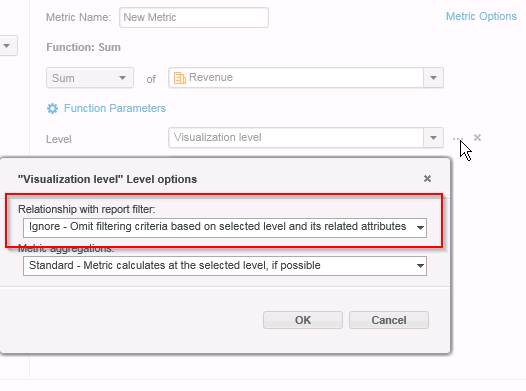
1) Create a new derived metric from the Revenue metric. Define the metric as Sum(Revenue).In the derived metric editor set the Level options to Ignore the report filter
2) Create an OLAPAvg derived metric using the derived metric created in step 1 as the base metric. In the Metric Options editor change the "Aggregation and Subtotal Behavior" to Manual and check the box for "Aggregate From Base.
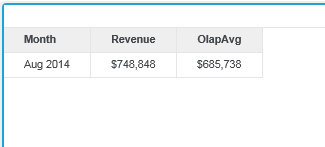
This will cause the the calculation of the OLAPavg metric to ignore the filter set in the dashboard. The metric will now calculate as desired.
KB439937