Starting with the release of Strategy ONE (March 2024), dossiers are also known as dashboards.
New Features & Functionality
How to Create an Age Pyramid Chart in Dossier
The Age Pyramid, also known as Population Pyramid, Tornado Chart or Pyramid Chart is not available out of the box in Strategy. However, this article will review an easy workaround to create one in Strategy. These types of charts are an excellent tool for evaluating differences and changes within a population across a particular variable such as gender across population ages. Want to learn more about when to use this chart? An example Dossier is attached to this Knowledge Base (version 10.10). Feel free to go straight to the dossier if you want to reuse or deconstruct it.
Preparation for the Age Pyramid
Create 2 new metrics, one for each side of the chart
Let's assume the scenario is a Gender attribute containing Women and Men is provided in the dataset.
The metric for each gender needs to be created.
The trick is to apply -1 multiplier to one of these metrics.
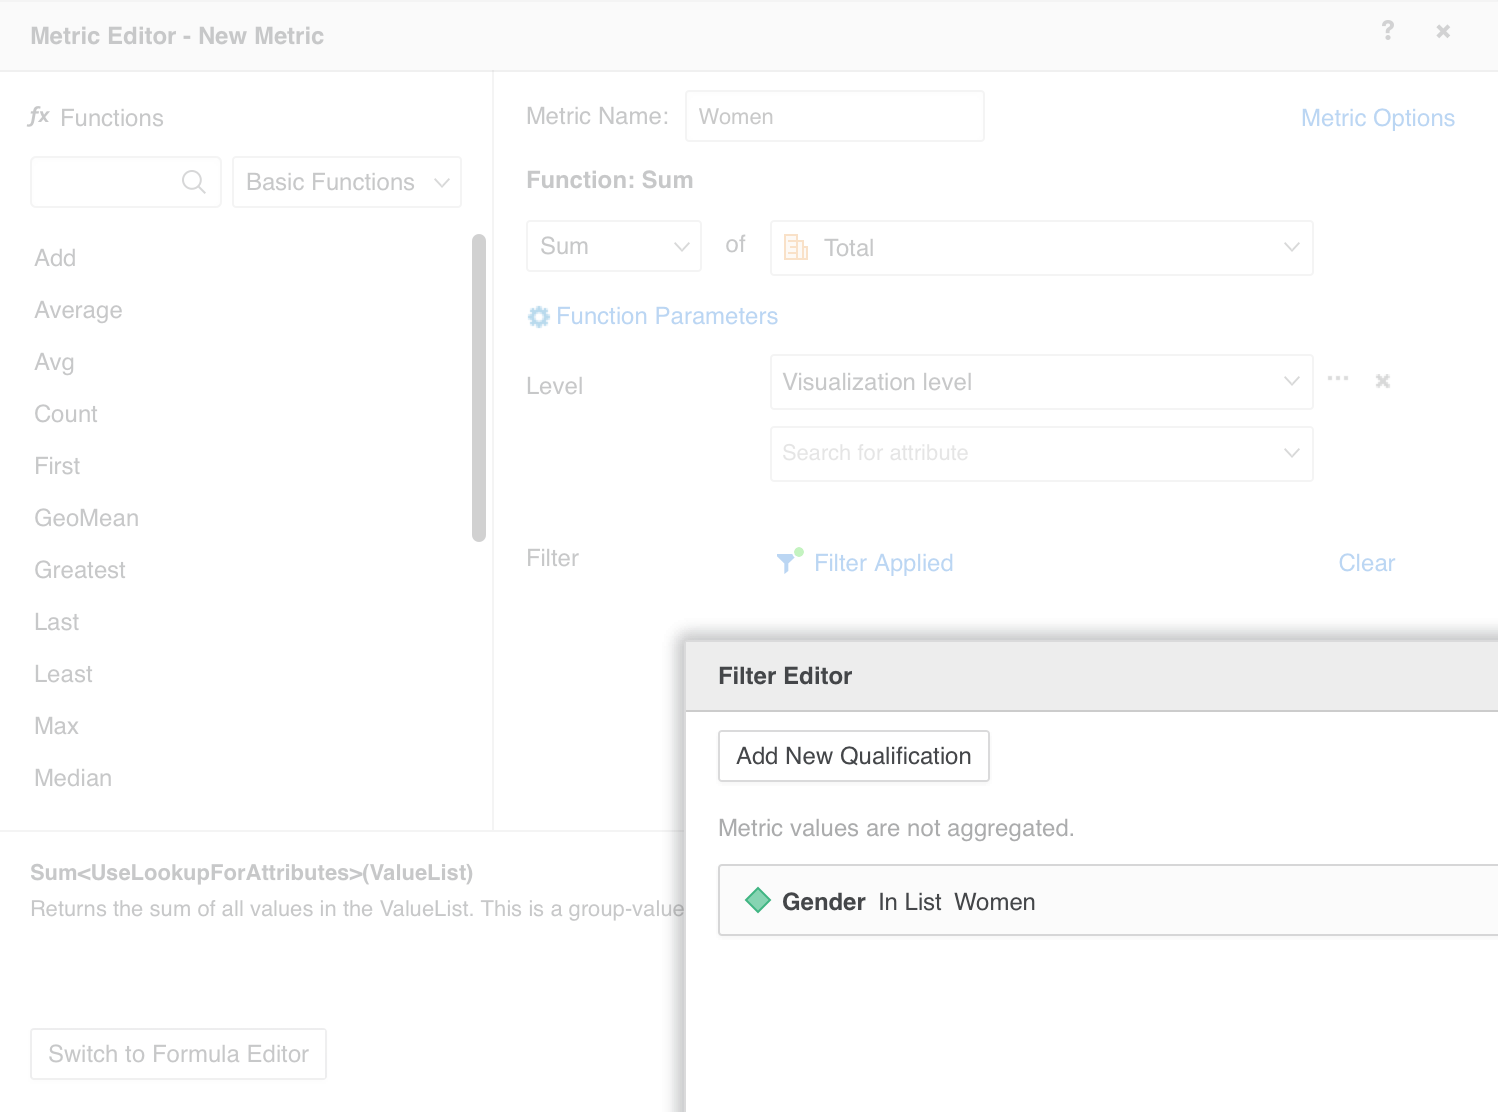
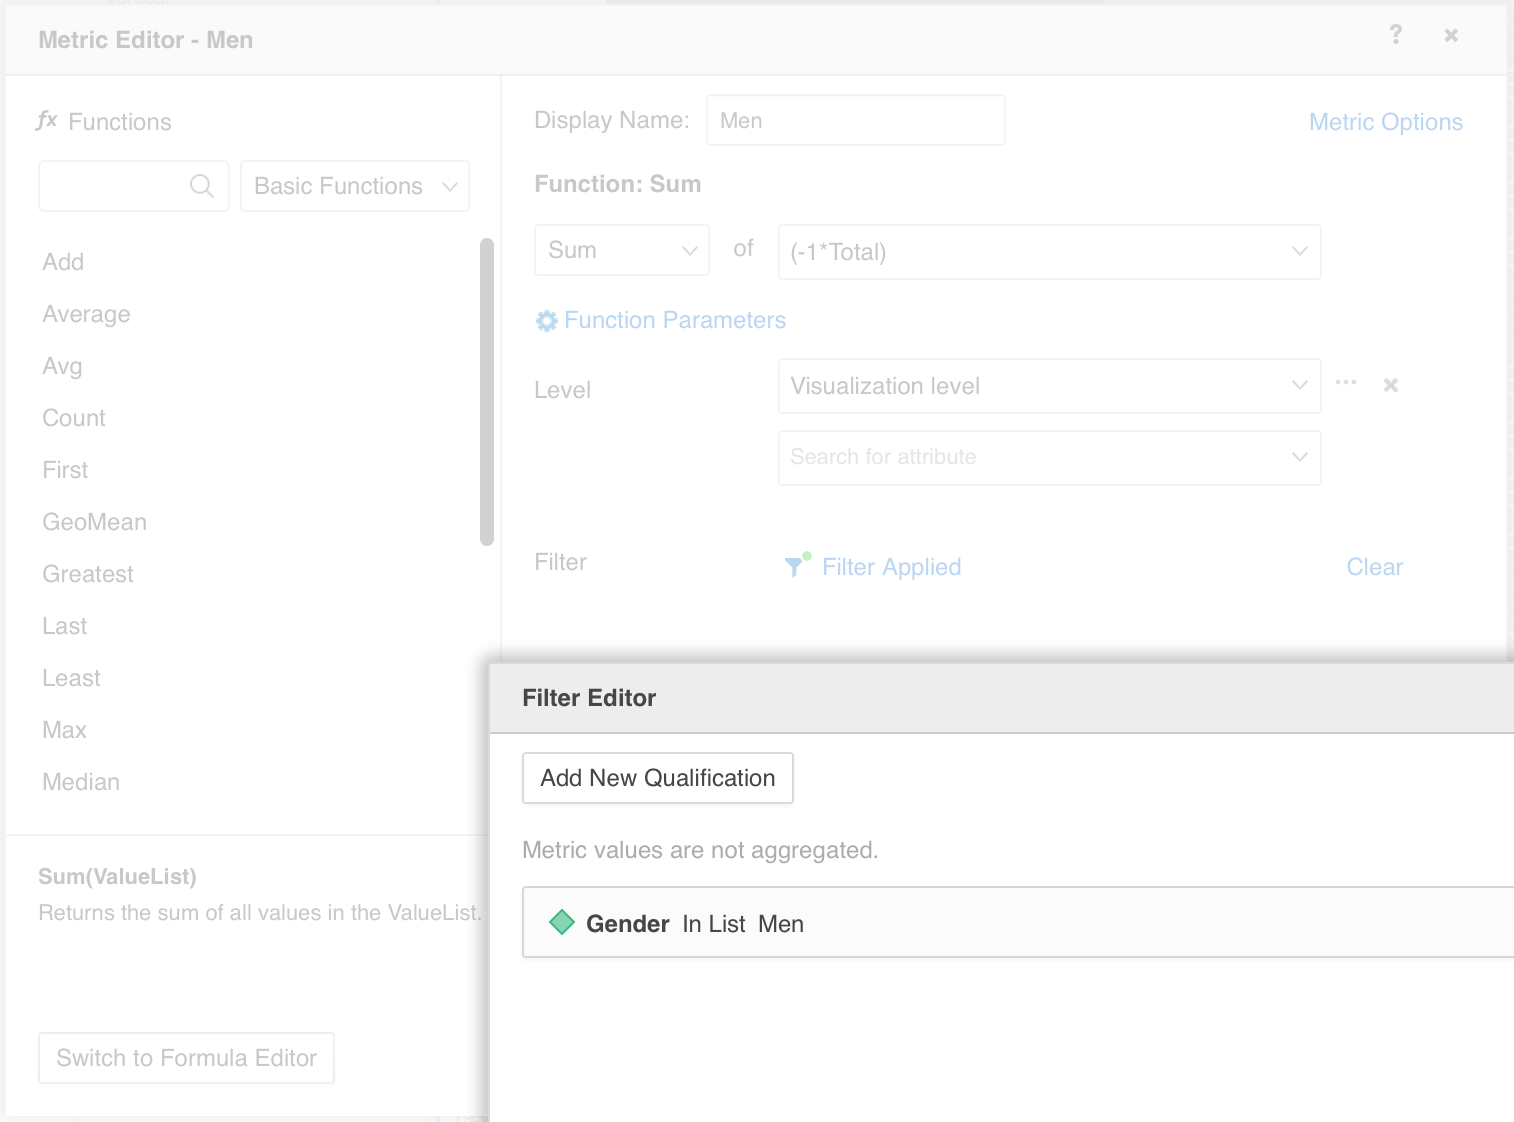
Note : Prior to Strategy Version 10.9, filter metrics are not supported.
A workaround is to use a Case metric:
Women Metric : Case(Gender@ID in "Women", [Population], 0)
Men Metric : Case(Gender@ID in "Men", -1*[Population], 0)
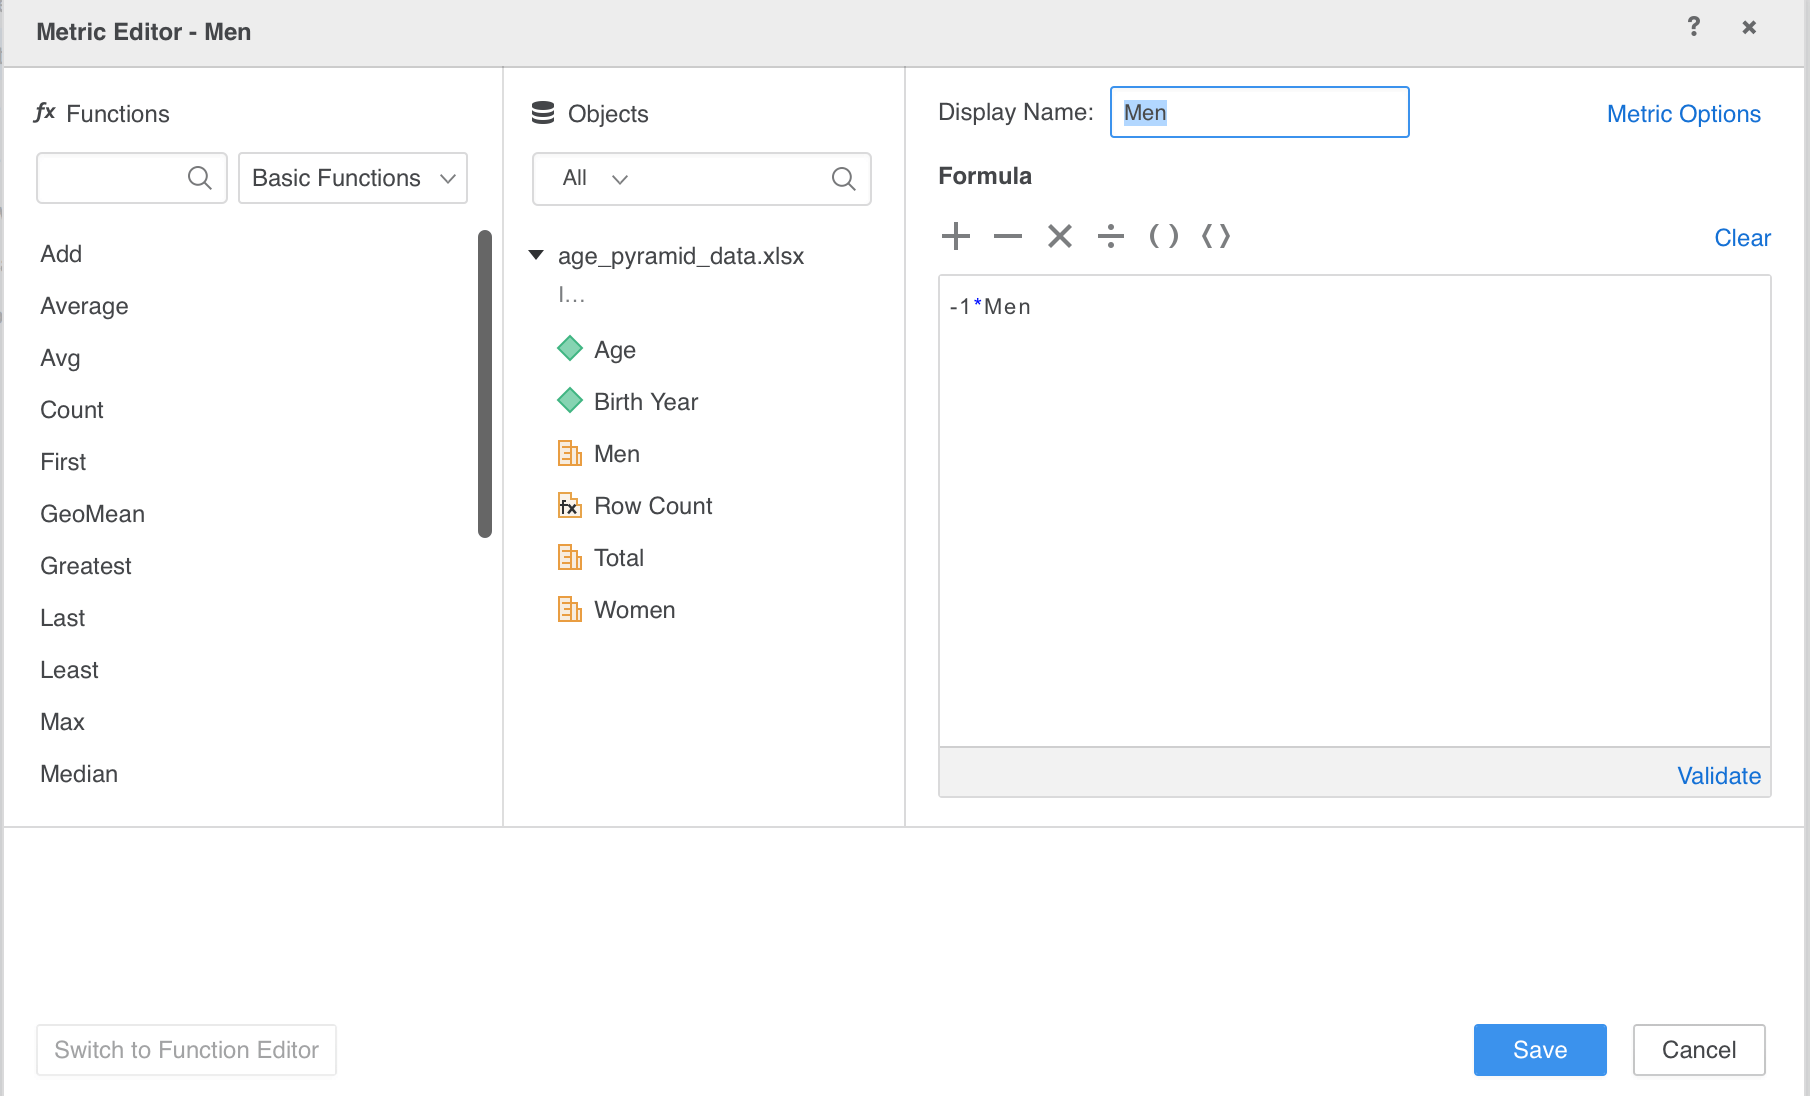
If you already have metrics for "Men" and "Women" defined, then all you need to do is to create a new "Men" metric to apply the -1 multiplier.
Formula for the metric "Men": -1*Men
Creating your chart
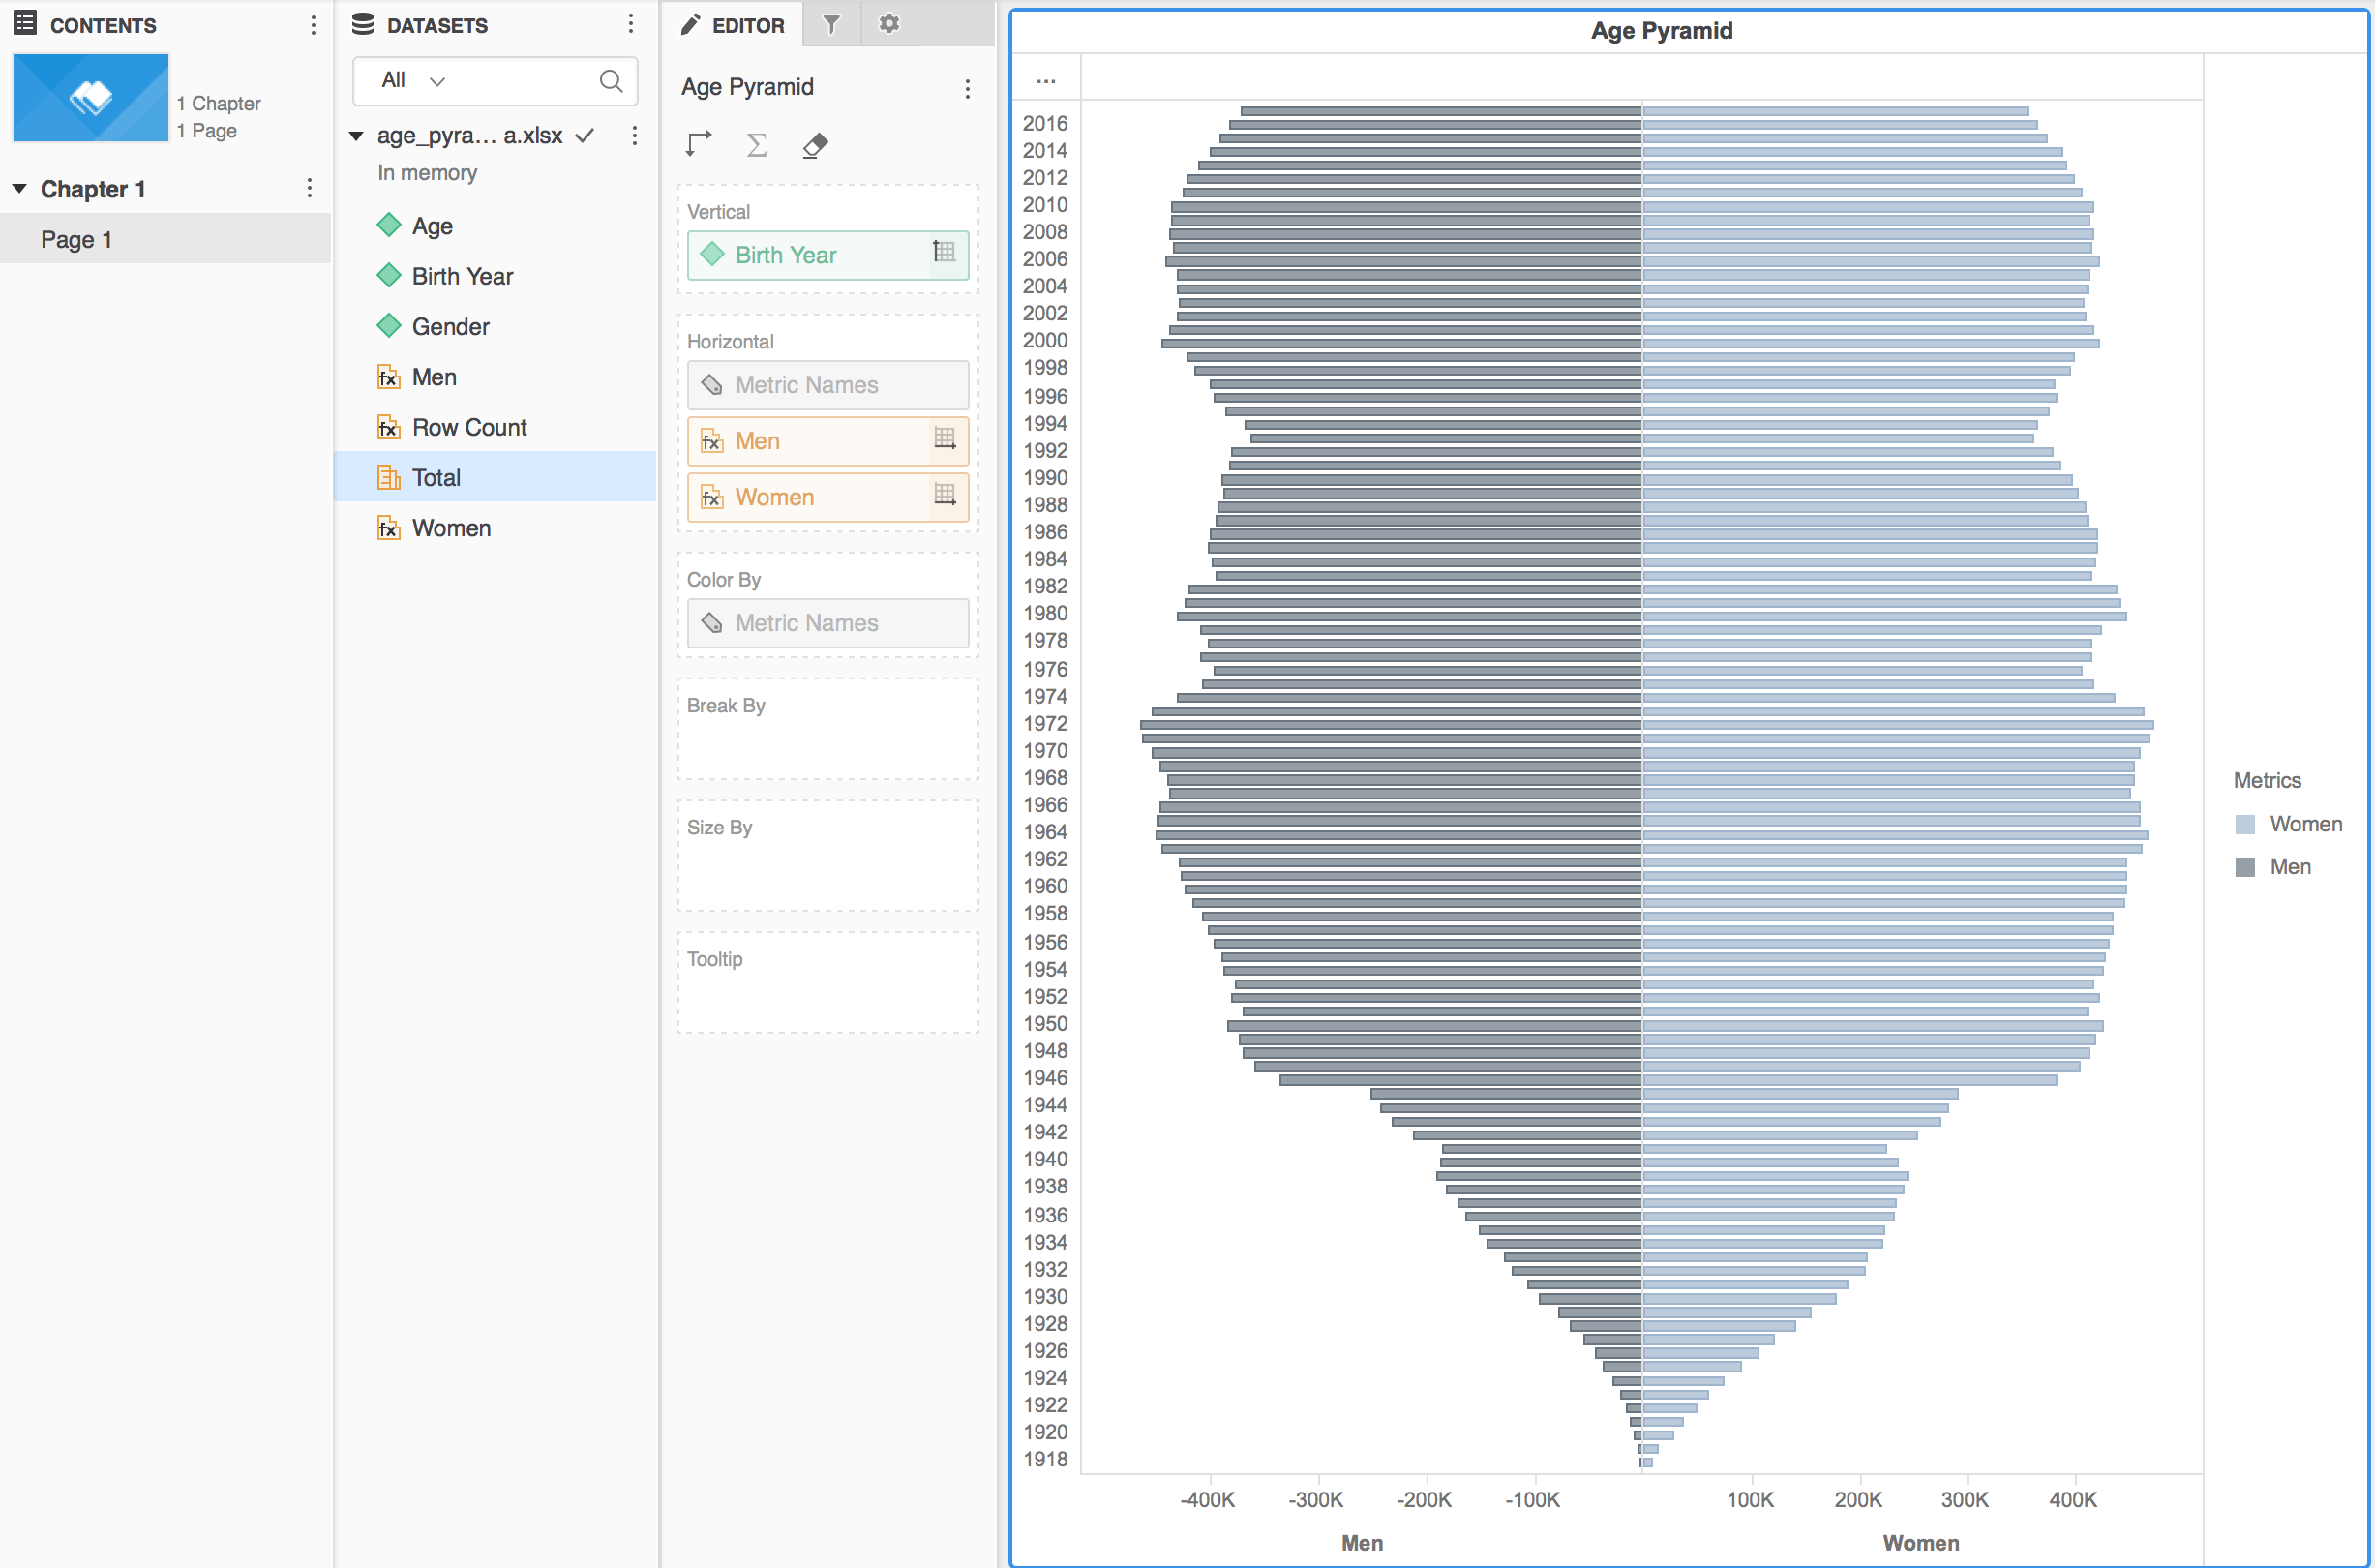
After dragging and dropping the correct elements, you should get the following result:
Want to know more about the data source for the chart?
Check it out! Data source : Insee - https://www.insee.fr/fr/statistiques/2381472
Have more questions? Feel free to start a discussion or reach out to your support liaison to create a case!
