EducationSoftwareStrategy.com
StrategyCommunity

Knowledge Base

Product

Community

Knowledge Base

TopicsBrowse ArticlesDeveloper Zone

Product

Download SoftwareProduct DocumentationSecurity Hub

Education

Tutorial VideosSolution GalleryEducation courses

Community

GuidelinesGrandmastersEvents
x_social-icon_white.svglinkedin_social-icon_white.svg
Strategy logoCommunity

© Strategy Inc. All Rights Reserved.

LegalTerms of UsePrivacy Policy
  1. Home
  2. Topics

KB415548: How to display trendline values generated by a graph using derived metrics in MicroStrategy Developer 10.x


Stefan Zepeda

Salesforce Solutions Architect • Strategy


How to display trend line values generated by a graph using derived metrics in MicroStrategy Developer 10.x

 
How to display trendline values generated by a graph using derived metrics in Strategy Developer 10.x
 
Graph objects have the ability to show trendlines for series, but the trendline value at each data point cannot be toggled on and off automatically like in a series option. Utilizing the generated trendline equation, user can manually create the data point values utilizing derived metrics as part of Strategy OLAP Services.
 
 
The following procedure describes how to display trendline data values on a graph utilizing sample data from the Strategy Tutorial Project. 

  • Create a new report/graph with attribute "Month" and metric "Revenue". Right-click on the graph to open Graph Options. Navigate to Series> Revenue > Trendline and apply a Linear Regression trendline; also check option to show equation:
     
ka044000000kLg2AAE_0EM440000002DKr.png


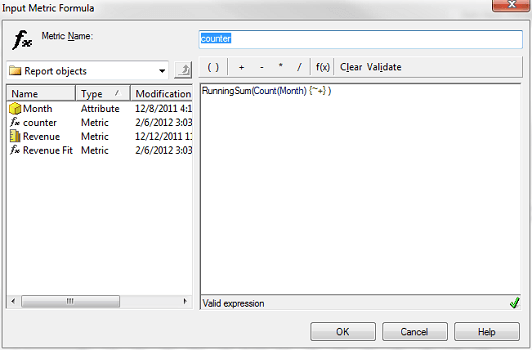
  •  Create a new Derived Metric "counter" into the report. The metric formula is given as: RunningSum(Count(Month){~+}). This metric will be used as the x-axis value for the input to the regression equation:
     
ka044000000kLg2AAE_0EM440000002DKv.png


  • Insert a new Derived Metric "Revenue Fit" into the report to act as the y-axis output from the regression equation. The metric formula is given as: ((27327.67 * counter) + 524453.01).
     
    Result: The trendline will now be plotted as data points (series label enabled):
ka044000000kLg2AAE_0EM440000002DKp.png

KB415548


Comment

0 comments

Details

Knowledge Article

Published:

May 31, 2017

Last Updated:

December 20, 2018