EducationSoftwareStrategy.com
StrategyCommunity

Knowledge Base

Product

Community

Knowledge Base

TopicsBrowse ArticlesDeveloper Zone

Product

Download SoftwareProduct DocumentationSecurity Hub

Education

Tutorial VideosSolution GalleryEducation courses

Community

GuidelinesGrandmastersEvents
x_social-icon_white.svglinkedin_social-icon_white.svg
Strategy logoCommunity

© Strategy Inc. All Rights Reserved.

LegalTerms of UsePrivacy Policy
  1. Home
  2. Topics

How to generate chloropleth maps with Python using data from MicroStrategy


Robert Prochowicz

Manager, Sales Engineering • MicroStrategy


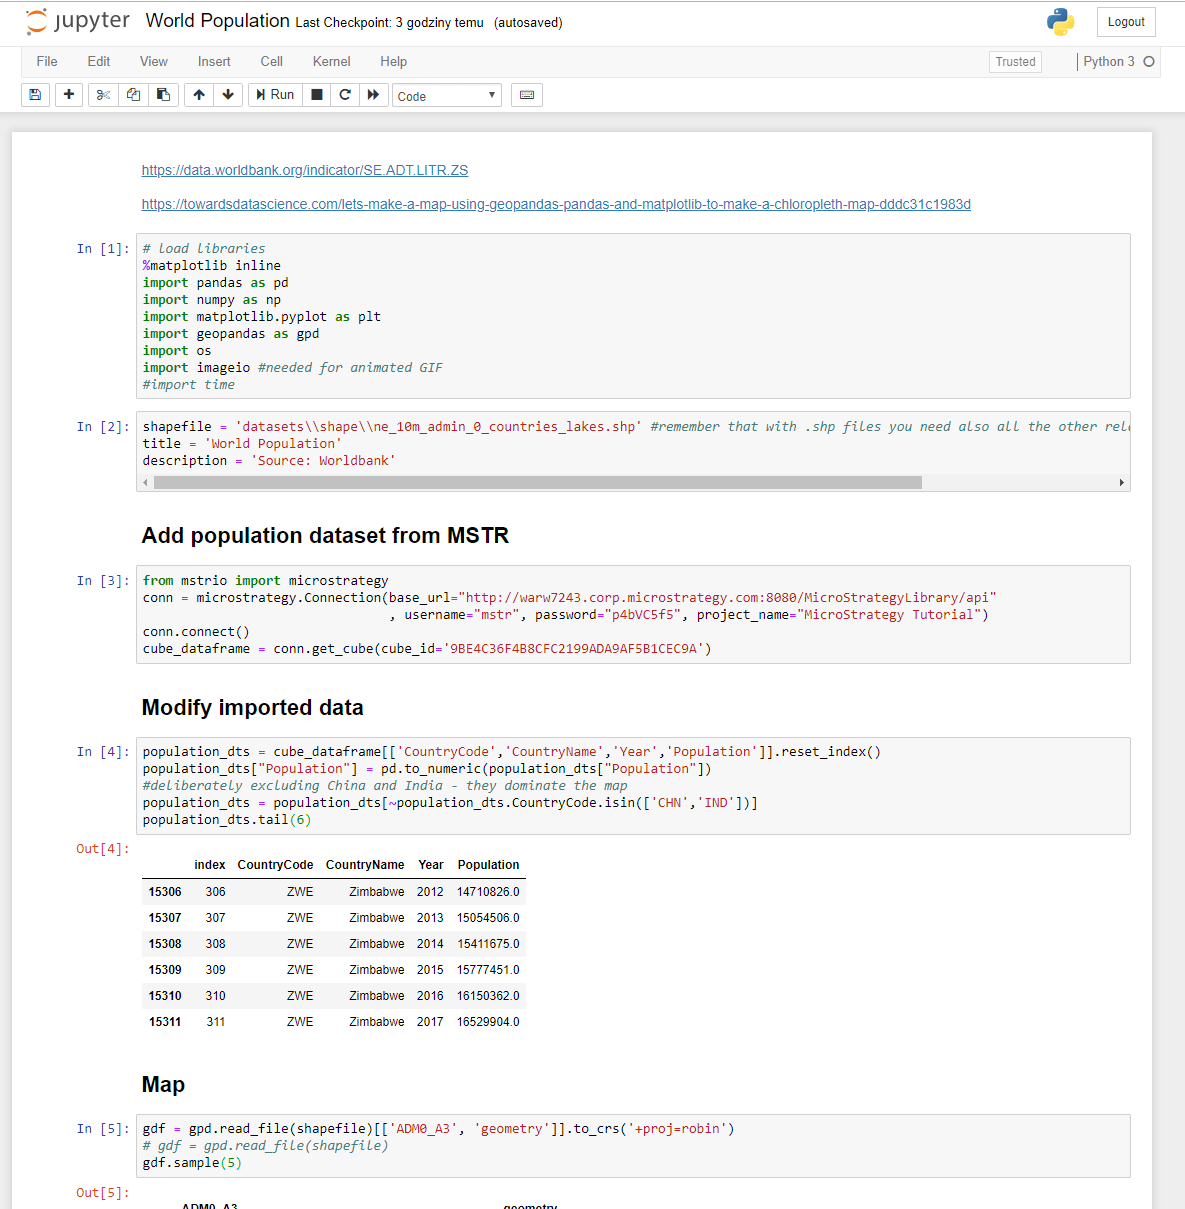
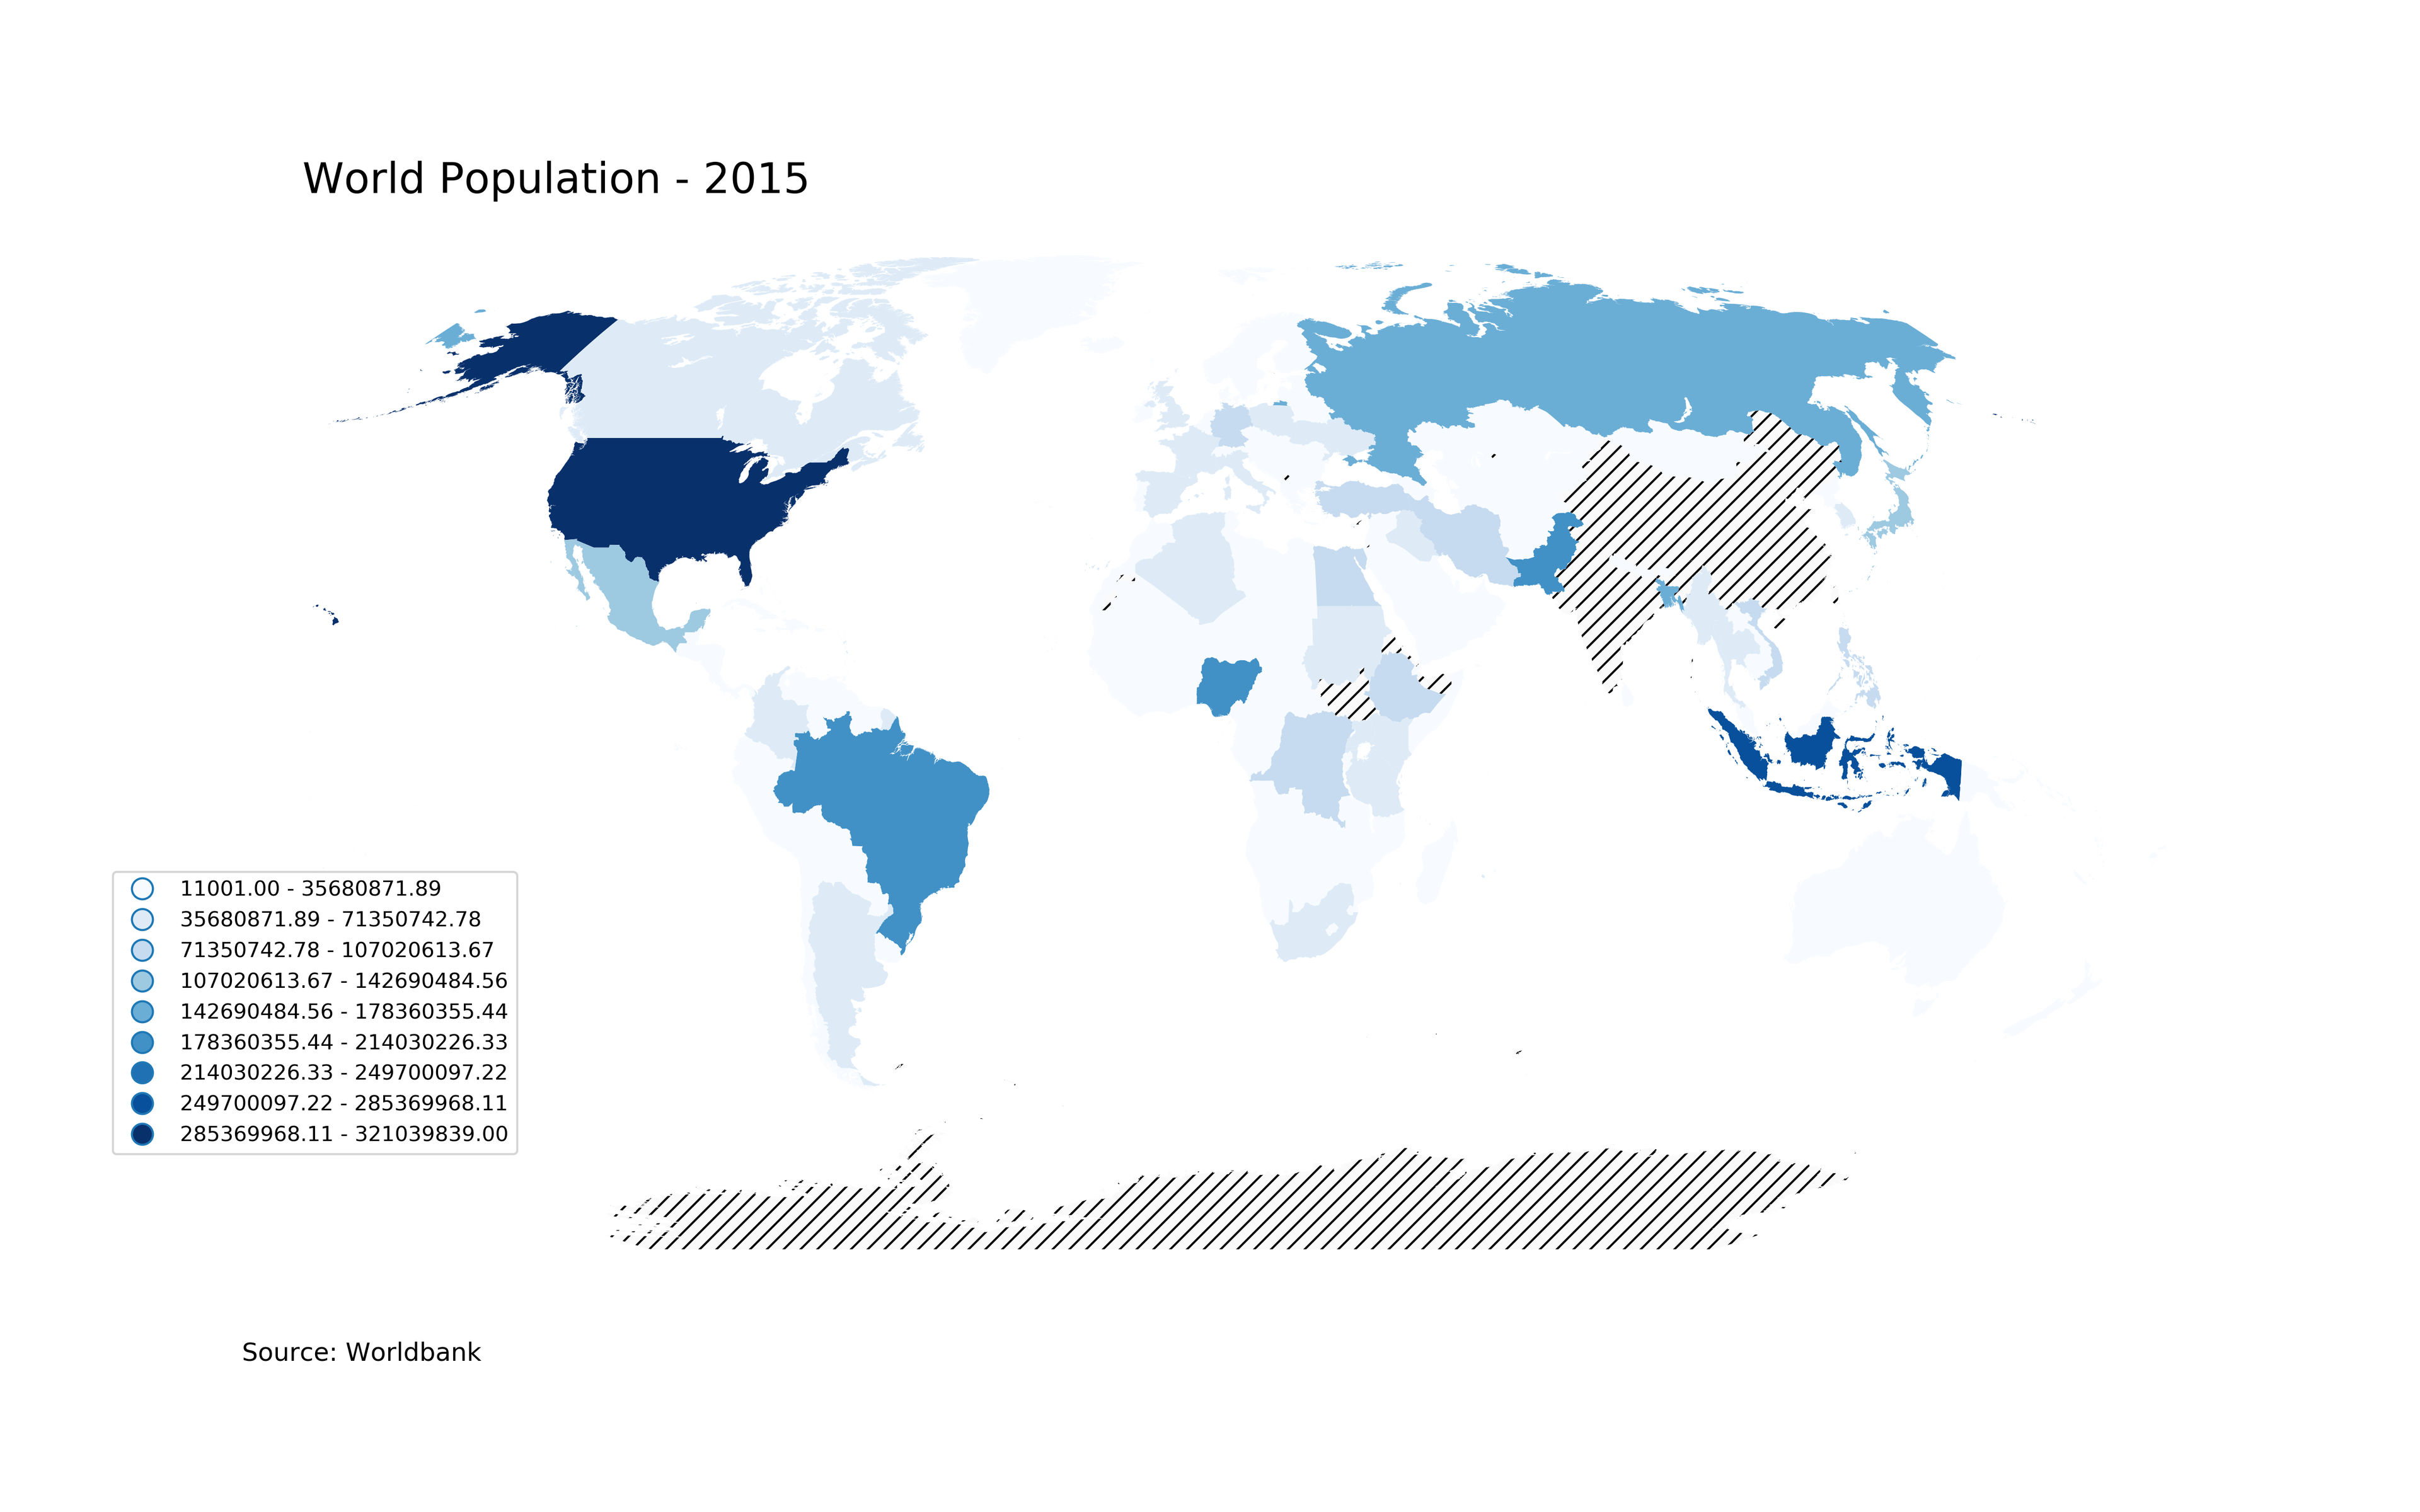
Currently (MSTR 11) Image Layout widget cannot be exported to PDF from RS Documents. The method described below can be used as a workaround. It is possible to use a Python program (using MSTR data) to generate chloropleth maps - for example countries of the World with color thresholds.

Python offers several libraries that help creating map visualizations. Using the code from this example, using mstrio library, one can produce several images with maps and save them to a folder with unique names. Later those maps can be added back to RS document by referencing their unique names.
Maps can be easily animated and, again, easily added back to RS document.
In attached zip file you will find:
- Jupyter notebook
- Python file
- excel file with statistics data
- shape file
- example of generated maps
ka044000000kREvAAM_0EM44000000RT51.png
ka044000000kREvAAM_0EM44000000RT56.png


Comment

0 comments

Details

Example

Published:

December 11, 2018

Last Updated:

December 11, 2018