EducationSoftwareStrategy.com
StrategyCommunity

Knowledge Base

Product

Community

Knowledge Base

TopicsBrowse ArticlesDeveloper Zone

Product

Download SoftwareProduct DocumentationSecurity Hub

Education

Tutorial VideosSolution GalleryEducation courses

Community

GuidelinesGrandmastersEvents
x_social-icon_white.svglinkedin_social-icon_white.svg
Strategy logoCommunity

© Strategy Inc. All Rights Reserved.

LegalTerms of UsePrivacy Policy
  1. Home
  2. Topics

KB441620: How to hide zeros in series values on a graph.


Hussam Bahia

Senior Manager, Technical Account Management • MicroStrategy


The ability to Hide zero's in a series value on Graph's.

How to hide zero’s in series values on a graph?
 
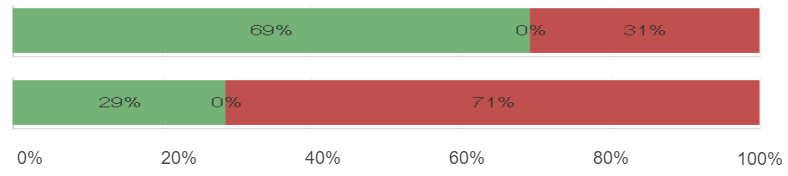
Sometimes we want to use a graph with labels showing series values. Some values can be 0's displayed by Strategy automatically. However, these might not be expected to be visible and choosing the option "Hide null/zero toggle behavior" in Properties and Formatting does not bring any results.
 
To show series values on a graph choose Format > Format > Series Values and tick the option 'Show' (in Editable Mode).
The default graph will display 0's:
ka044000000kPQgAAM_0EM44000000QjeO.png

Solution:
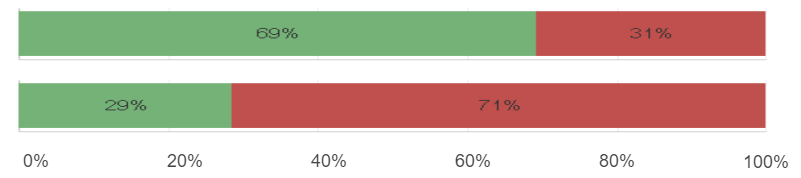
The way to hide unwanted 0's is converting values from zero to null while building metrics.

ka044000000kPQgAAM_0EM44000000QjeY.png

Navigate to: Functions and Operations > Functions > Null/Zero
There is a function 'ZeroToNull' which should be added to every metric with the potential 0's on a graph.
 
 
The graph with zero to null conversion:
ka044000000kPQgAAM_0EM44000000QjeJ.png

  KB441620


Comment

0 comments

Details

Knowledge Article

Published:

September 4, 2018

Last Updated:

December 27, 2018