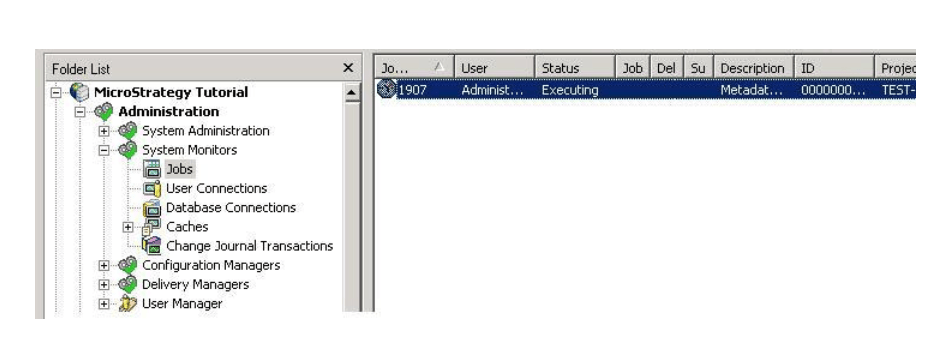
The first thing to do is to have a look at the Job Monitor. The Job Monitor informs you of what is happening with system tasks. However, it does not display detailed sub-steps that a job is performing. You can see jobs that are:
•Executing
•Waiting in the queue
•Waiting for a user to reply to a prompt
•Canceling
•Not completing because of an error
The Job Monitor displays which tasks are running on an Intelligence Server. When a job has completed, it no longer appears in the monitor. You can view a job’s identification number; the user who submitted it; the job’s status; a description of the status and the name of the report, document, or query; and the project executing it.
In order to see what is going on with the job, please enable from “Strategy Diagnostics and Performance Logging Tool” the following logs:
The ID of the Job would be useful in order to read the job trace
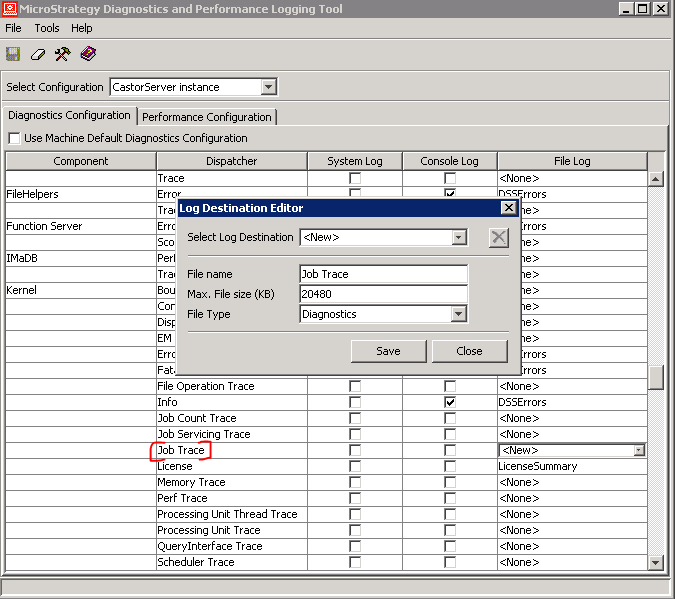
When you enable these traces, be sure to enlarge the size of trace file to >20MB. Restart the Intelligent Server.
In order to understand what is going on with the job the best approach would be to collect pstack from the Intelligent Server machine as per KB17216:
https://community.Strategy.com/s/article/KB17216-Steps-to-follow-to-collect-troubleshooting-information?t=1500478917290
Pstack collects the call stack at a particular moment in time. We can therefore see all the threads in the server, and what each of them is doing. So, when we collect multiple stacks, we can see if any of the threads are stuck for a long time due to the same task. This can help to indicate what triggers the hang. Pstacks are the most useful debugging tool when it comes to hang situations.
Check following tables:
and / or
or
Please be aware that jobs that do not complete do not get into statistics tables. If we have 10 jobs running on the server when the server crashes, we do not know what exactly was running at that time since these jobs will never get into statistics (as these did NOT complete).
KB442334