Starting with the release of Strategy ONE (March 2024), dossiers are also known as dashboards.
This type of chart is typically used to represent financial data for a given time period. We allow drawing up to two of these waterfall charts (for two different scenarios) to compare performance.
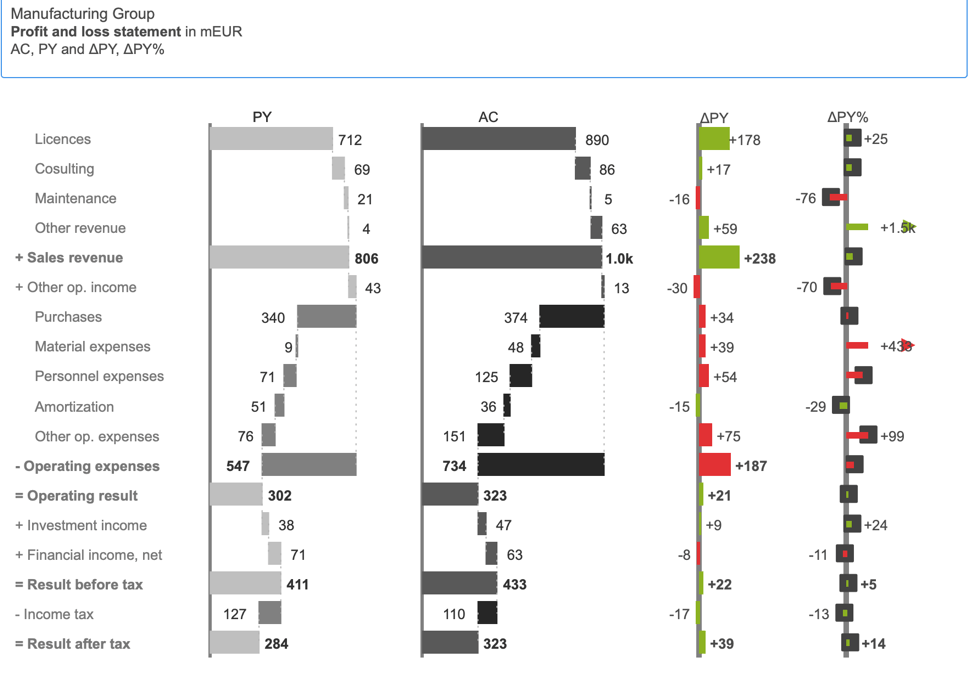
The vertical waterfall chart shows grouped bars for AC and PL combined with a vertical waterfall showing the absolute variances. It is sorted by absolute variances to PL and it is extended by an additional bar for PY. Two additional tiers show the relative variances to PL and PY.
Income statement for current year, past year , absolute variance and % variance
Requirements:
Metric >2
Video demo : https://youtu.be/NWjvF8L3t50
Minimum Strategy version 10.3 or higher
Chart Version : 4.2
MicroStrategy Features
Vitaracharts is now FREE for Desktop and Workstation.
Please contact sales@vitaracharts.com to get a 30-day trial key.
Take note that this visual is a part of the VitaraCharts library.
Download visualizations: www.vitaracharts.com
Online interactive visualizations can be accessed here: https://cloud.vitaracharts.com
Publisher: Vitara
Vitara is a Strategy technology partner and offers a fully supported, production-ready chart plugin (VitaraCharts) with 30+ stunning visualizations to enhance Strategy analytics. All Vitara visualizations are customizable and supported through upgrades for a hassle-free experience. We perform extensive testing for backward compatibility with all currently certified versions of Strategy and also ensure all new versions of Strategy are tested and supported across all charts.
For more details please contact sales@vitaracharts.com or www.vitaracharts.com.