Widget View mode
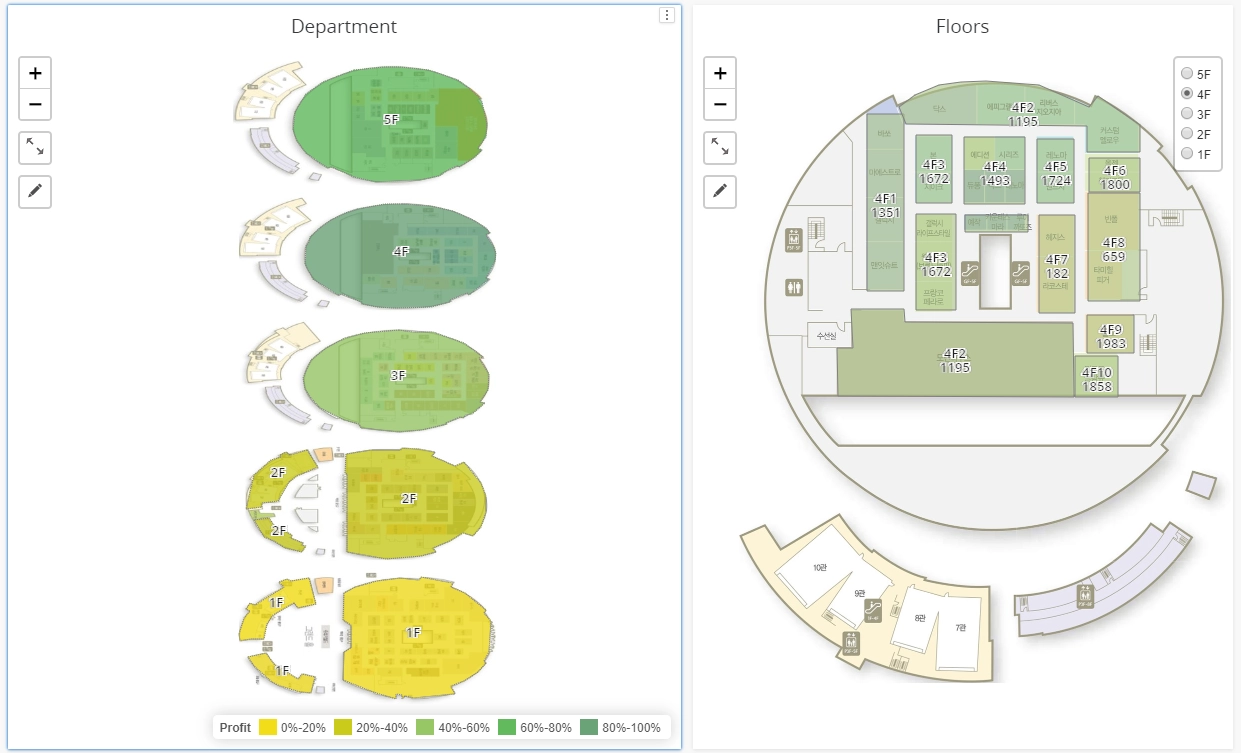
Widget Edit mode - create , edit and delete shapes and name the shape

Version update 24 , Apr, 2020
Fixed accuracy of drawing mode (There was 2px dis-alignment because of border)
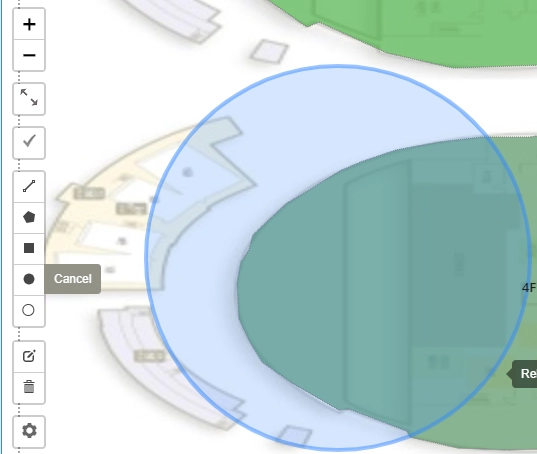
New drawing tool : Circle and Line in the drawing toolbar
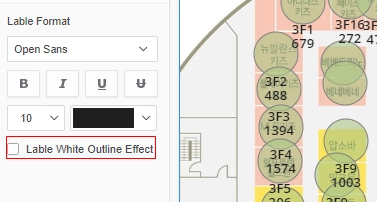
Added Option for remove white outline of data label.
How to Use
1 Add Shape attribute and any metric to the widget
2. Add Overlay Image Path to the widget . Image path is URL format

3. Click pen Icon

to edit shape
you can create Line, Poly , Rectangle and point using the toolbar.

4. You can edit points of the shape and delete and check geojson data of the widget .
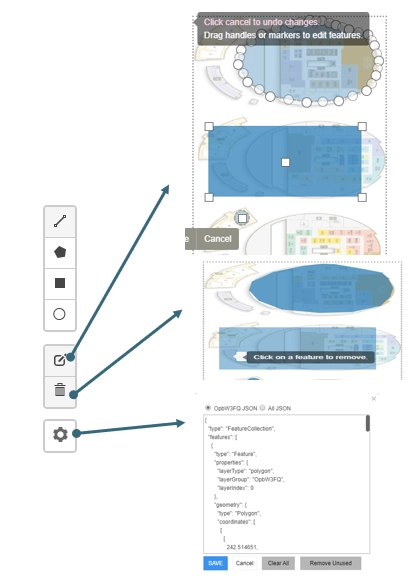
5. You should set Shape ID to match shape and the elements of the shape attribute to visualize. When you click shape in the edit mode , it'll show you input dialog to input shape ID. Shape ID will be used to match data. * It's case sensitive .

6. You can set threshold. The widget will use first metric's threshold for formatting shape.
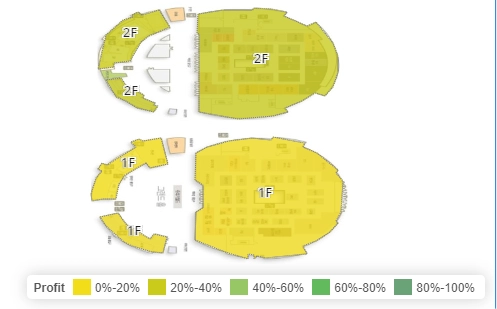
If you have any feedback, please leave comments in here.
It's free visualization plug-in.
Free to download
Object requirements:
·Attributes: 1
·Metrics: 1
Minimum Strategy version: 2019
Current visualization version: 1.0
Publisher: DongHyub Lee ( Sales Engineer in Strategy Korea)
Strategy Features
Supports custom properties
PDF Export
Selector
Updated 08/17 2021 .
Bug fix for Strategy 2021 update2 - Widget shows error in format tab.
Updated 10/08/2020 .
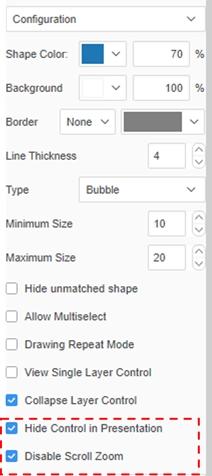
Added new options of disable zoom control in presentation mode and disable zoom scroll functionality
Installation instructions
• To install this visualization, download the .zip file below and deploy it in Strategy Desktop or Strategy Web.
• After you have installed the visualization, you can open a working demo of this visualization by uploading the .mstr file below and doing the following:
o To open the demo visualization in Strategy Desktop, double click the .mstr file.
o To open the demo visualization in Strategy Web, choose Create -> Upload Strategy File -> View Dashboard
Visualization Disclaimer
By downloading or using this visualization, you accept and acknowledge these terms.
This visualization is both intended as sample code and provided as a convenience to Strategy users. Strategy cannot guarantee that the code provided will apply to any Strategy releases and clients outside of the versions stated within this article. This sample is supported by Strategy Technical Support up to and including the basic visualization functionality listed in this article. Defects will be triaged by the Strategy team as they are raised. For users with active Strategy Technical Support contracts, contact Strategy Technical Support to raise these defects.
Open Source
Leaflet.js , LeafletDraw.js and Leaflet easybutton library is included in the widget code
