EducationSoftwareStrategy.com
StrategyCommunity

Knowledge Base

Product

Community

Knowledge Base

TopicsBrowse ArticlesDeveloper Zone

Product

Download SoftwareProduct DocumentationSecurity Hub

Education

Tutorial VideosSolution GalleryEducation courses

Community

GuidelinesGrandmastersEvents
x_social-icon_white.svglinkedin_social-icon_white.svg
Strategy logoCommunity

© Strategy Inc. All Rights Reserved.

LegalTerms of UsePrivacy Policy
  1. Home
  2. Topics

KB485450: In MicroStrategy Web 2021 a user is only able to target visualizations from one layer but not from multiple on the ESRI map in Dossier.


Elena Arman

Senior Support Engineer • Strategy


This article describes an issue with targeting visualizations from multiple layers on ESRI map in Dossier.

Starting with the release of Strategy ONE (March 2024), dossiers are also known as dashboards.

Symptom


User sets up an ESRI map with 2 or more layers that targets other visualizations in Dossier in Strategy Web 2021. However, user notices that target visualizations are not get updated after clicking on areas or markers from all layers on ESRI map, users are able to update other visualization only from one layer.  

Steps to reproduce

  1. Create an Excel with the following data, import the file into Strategy Tutorial and create a Dossier.
ka0PW0000001JhRYAU_0EM4W000004Z4xo.jpeg
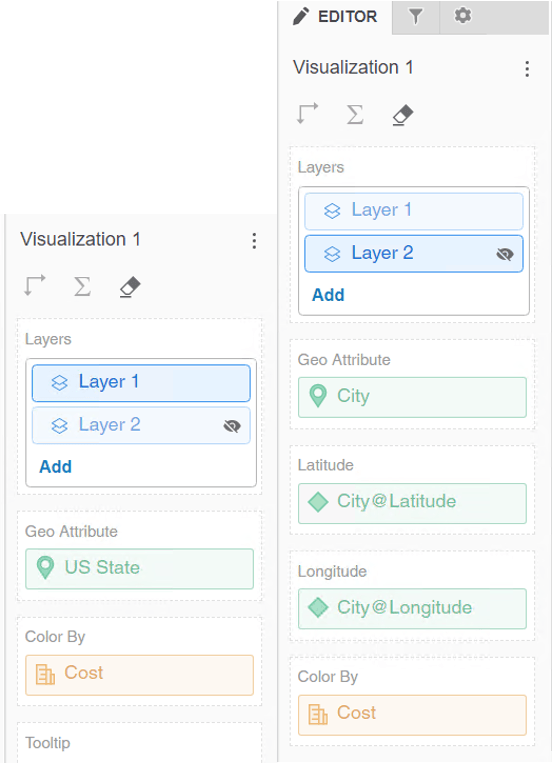
  1. Create an ESRI Visualization with US State attribute and Cost metric on Layer 1 and with City Geo attribute and Cost metric on the Layer 2. 
ka0PW0000001JhRYAU_0EM4W000004Z4xy.jpeg


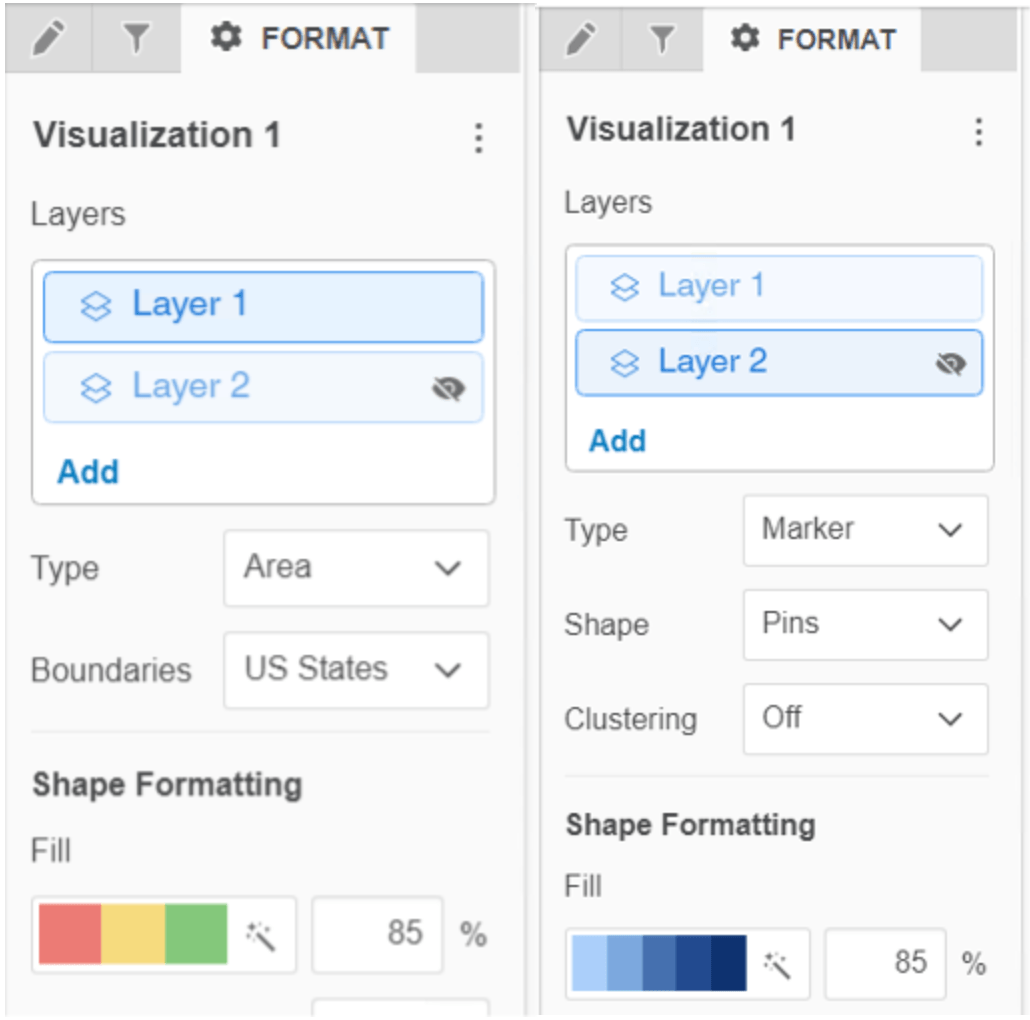
  1. On Format tab for Layer 1 pick “Area” under Type and “US States” under Boundaries and under Format tab for Layer 2 pick “Marker” type and “Pin” for Shape:
ka0PW0000001JhRYAU_0EM4W000004Z4yD.jpeg
  1. Create a new grid visualization with all attributes and the metric. 
  2. Make sure that ERSI map targets the grid visualization. 
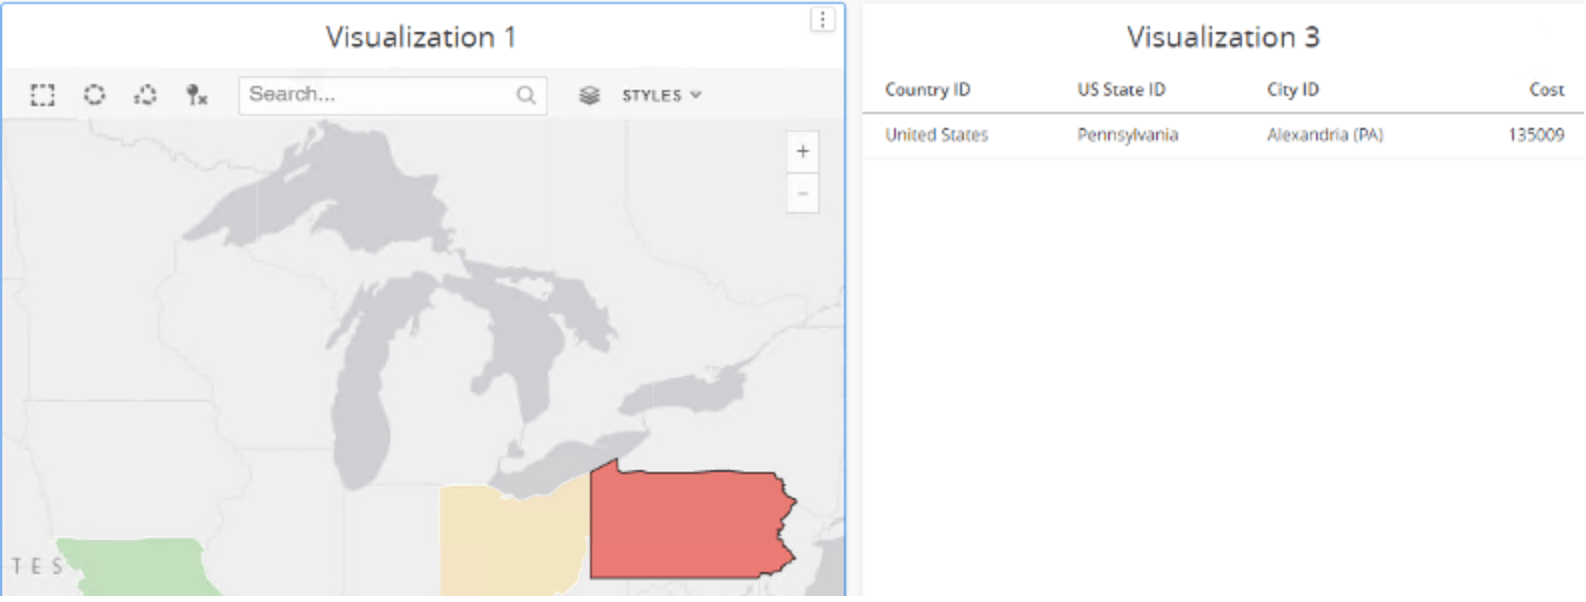
  3. On ESRI Map pick only Layer 1
ka0PW0000001JhRYAU_0EM4W000004Z4yN.jpeg
  1. Click on Pennsylvania and observe that Grid visualization gets updated properly.
ka0PW0000001JhRYAU_0EM4W000004Z4yX.jpeg
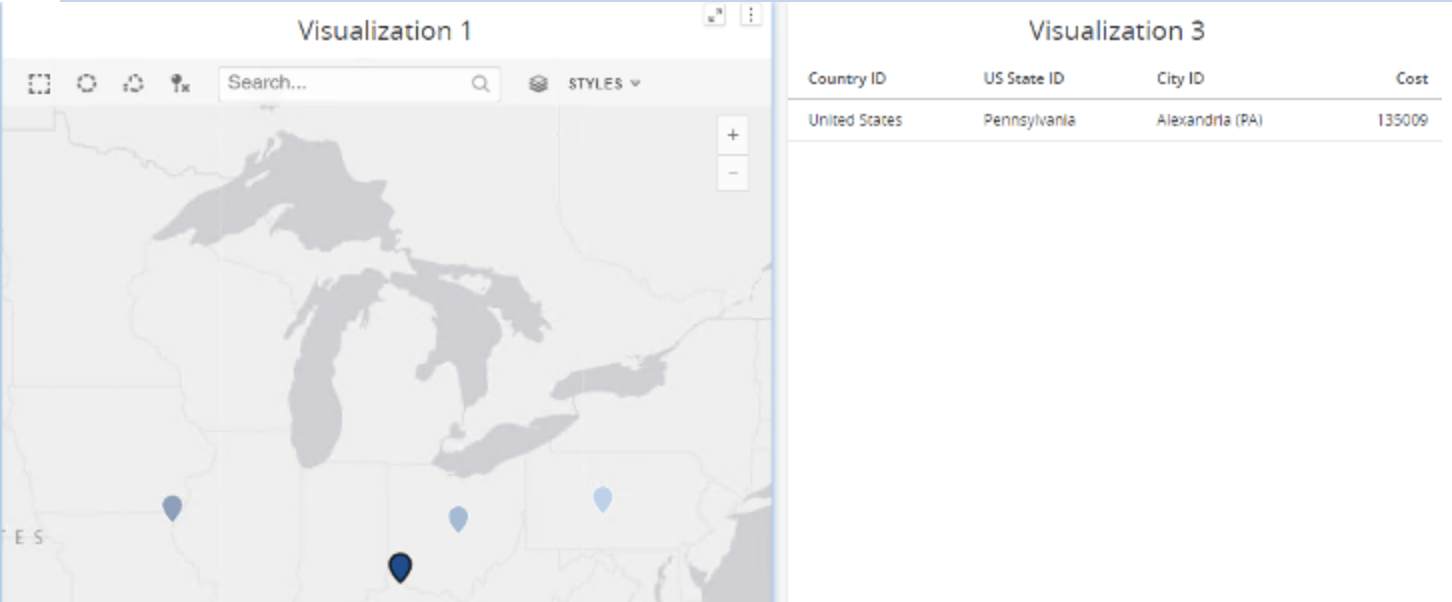
  1. Pick Layer 2 on ESRI Visualization and click on Alexandria (KY) marker and observe that the grid visualization does not get updated but still shows Pennsylvania, previous selection.
ka0PW0000001JhRYAU_0EM4W000004Z4ym.jpeg


Cause


This is a limitation in Strategy. Enhancement Request has been submitted to be able to target other visualizations from any layer on ESRI map. 
 

Action


Contact Strategy Technical Support for the update on the status of the enhancement request. 


Comment

0 comments

Details

Knowledge Article

Published:

April 5, 2022

Last Updated:

March 21, 2024