EducationSoftwareStrategy.com
StrategyCommunity

Knowledge Base

Product

Community

Knowledge Base

TopicsBrowse ArticlesDeveloper Zone

Product

Download SoftwareProduct DocumentationSecurity Hub

Education

Tutorial VideosSolution GalleryEducation courses

Community

GuidelinesGrandmastersEvents
x_social-icon_white.svglinkedin_social-icon_white.svg
Strategy logoCommunity

© Strategy Inc. All Rights Reserved.

LegalTerms of UsePrivacy Policy
  1. Home
  2. Topics

In MicroStrategy, how to create a report that will dynamically show the distinct count of an attribute at different levels


Community Admin

• Strategy


This tutorial covers the steps to create a dynamic count distinct metric using a base metric in MicroStrategy

Introduction:
 
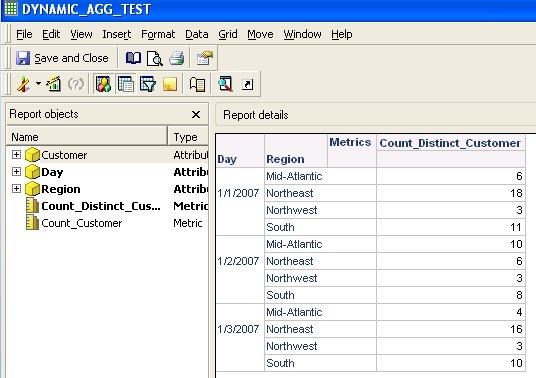
Consider a report which has attributes Day, Region, and Customer. Add a metric that calculates the distinct count of customer. The metric is defined with the expression:
 
Count<Distinct=True, FactID=>(Customer) {~}. 
 
When the report is executed, the data is as shown below:
 

ka04W000000OfyzQAC_0EM440000002Do9.jpeg

 
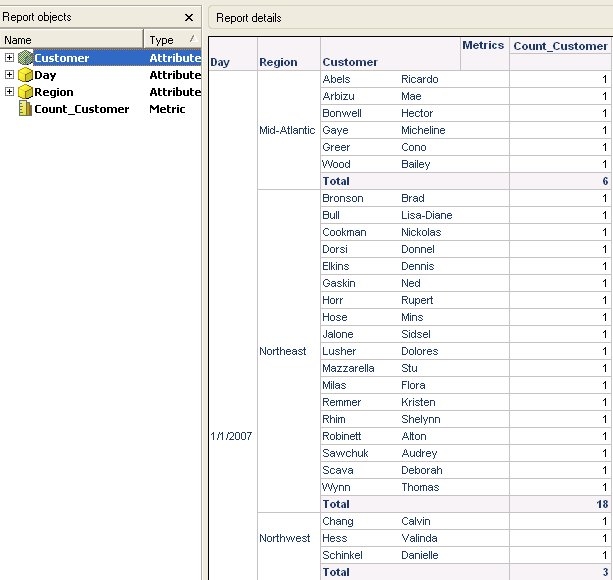
The requirement is to have the value for the metric: count distinct customer to be calculated dynamically. In other words, depending on the attributes present on the grid, the count metric should be calculated at that level. For example, if the attribute 'customer' is removed from the grid, the requirement is to get a count of cutomers at the level of Day, Region.
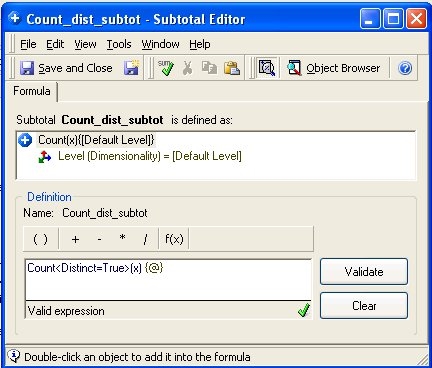
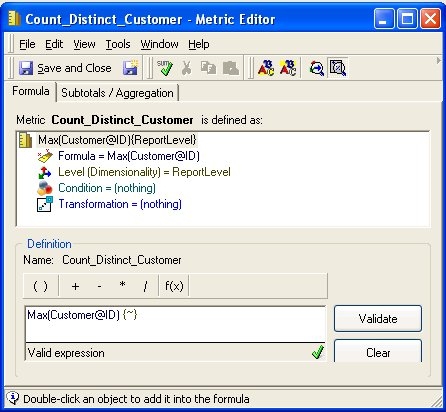
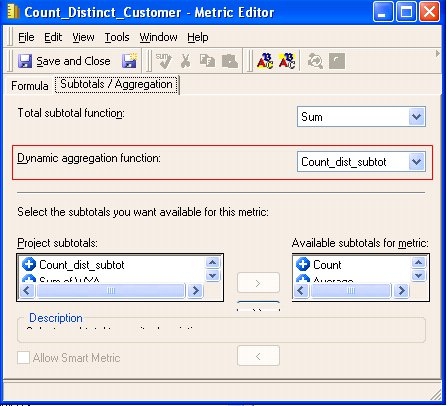
The above metric cannot fulfill this requirement even after adding the required dynamic aggregation function. To get this data, perform the steps provided below:  
 

  • Create a custom subtotal object which is defined with the expression: Count<Distinct=True>(x) {@}, as shown below 

ka04W000000OfyzQAC_0EM440000002Do7.jpeg


  • Create a metric object which is defined as: Max(Customer@ID){~+}, as shown below:

ka04W000000OfyzQAC_0EM440000002DoB.jpeg
  • Go to the subtotals/aggregation tab of the above created metric and make the subtotal created in Step 1 as the dynamic aggregation function as shown below. 

ka04W000000OfyzQAC_0EM440000002DoC.jpeg


  • Add the metric from Step 2 to the report shown above. When the 'Customer' attribute is removed from the grid, the newly created metric dynamically shows the distinct count of customers at the Day, Region level as shown below. If the Region attribute is removed from the grid, the metric value is dynamically aggregated to the Day level. 

ka04W000000OfyzQAC_0EM440000002DoA.jpeg

Comment

0 comments

Details

Knowledge Article

Published:

June 12, 2017

Last Updated:

June 12, 2017