EducationSoftwareStrategy.com
StrategyCommunity

Knowledge Base

Product

Community

Knowledge Base

TopicsBrowse ArticlesDeveloper Zone

Product

Download SoftwareProduct DocumentationSecurity Hub

Education

Tutorial VideosSolution GalleryEducation courses

Community

GuidelinesGrandmastersEvents
x_social-icon_white.svglinkedin_social-icon_white.svg
Strategy logoCommunity

© Strategy Inc. All Rights Reserved.

LegalTerms of UsePrivacy Policy
  1. Home
  2. Topics

In Web 2019, the Combo chart visualization does not display correctly


Community Admin

• Strategy


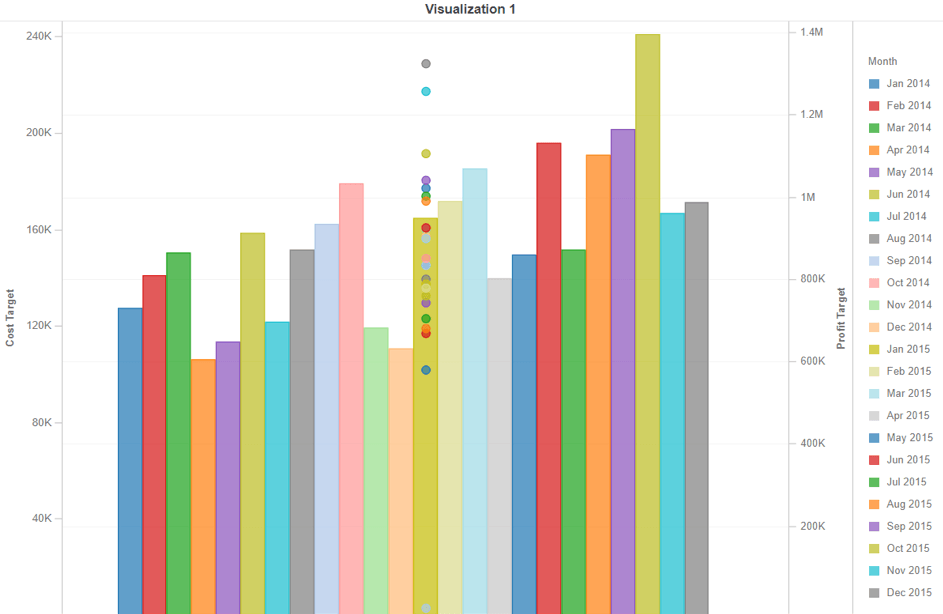
This article describes a known issue in MicroStrategy Web that occurs when using the combo chart with dots in a dossier.

Starting with the release of Strategy ONE (March 2024), dossiers are also known as dashboards.

Description


In Strategy Web 2019, creating a Combo chart visualization with an attribute in the Break-by field, and no attribute in the Horizontal field, causes the dots on the visualization to appear incorrectly. 
 

https


Expected BehaviorCurrent Behavior

https


Expected BehaviorCurrent Behavior

Steps to Reproduce

  • In Strategy Web, create a dossier.
  • Choose the Combo Chart visualization.
  • Place two metrics in the Vertical field.
  • Place one attribute in the Color By field. 
  • Place the same attribute in the Color By field in the Break By field.
    The Editor panel should appear as follows:
ka0PW0000001Ja0YAE_0EM2R000000mIiX.jpeg
  • The dots in the visualization do not match Break By values do not correspond to the metrics in the Vertical field. 
ka0PW0000001Ja0YAE_0EM2R000000mIic.jpeg

Why is this happening?


This is a known issue in Strategy 2019.
 

Solution


This issue has been addressed in Strategy 2019 Update 4 and later. Please upgrade to these versions to take advantage of this fix.


Comment

0 comments

Details

Knowledge Article

Published:

October 4, 2019

Last Updated:

March 21, 2024