EducationSoftwareStrategy.com
StrategyCommunity

Knowledge Base

Product

Community

Knowledge Base

TopicsBrowse ArticlesDeveloper Zone

Product

Download SoftwareProduct DocumentationSecurity Hub

Education

Tutorial VideosSolution GalleryEducation courses

Community

GuidelinesGrandmastersEvents
x_social-icon_white.svglinkedin_social-icon_white.svg
Strategy logoCommunity

© Strategy Inc. All Rights Reserved.

LegalTerms of UsePrivacy Policy
  1. Home
  2. Topics

KB438958: In a Report Services Document, a triggered information window containing a converted Visual Insight visualization shows the error "The following custom visualization plug-in is missing and will be displayed as a grid" in MicroStrategy Web 10.x


Community Admin

• Strategy


This knowledge base article describes an identified defect in MicroStrategy Web 10.x. In a Report Services Dcoument, triggering an information window containing a bar graph converted from a Visual Insight dashboard throws the specified error. This issue only occurs when executing the information window first, switching layouts, switching back to the original layout, and triggering the information window again. This issue is under review from the MicroStrategy team.

SYMPTOM:
In Strategy Web 10.x, a Visual Insight dashboard can be converted to a Report Services Document to leverage the pixel-perfect functionality, among other features. The visualizations in the newly converted document can be used in a variety of ways.
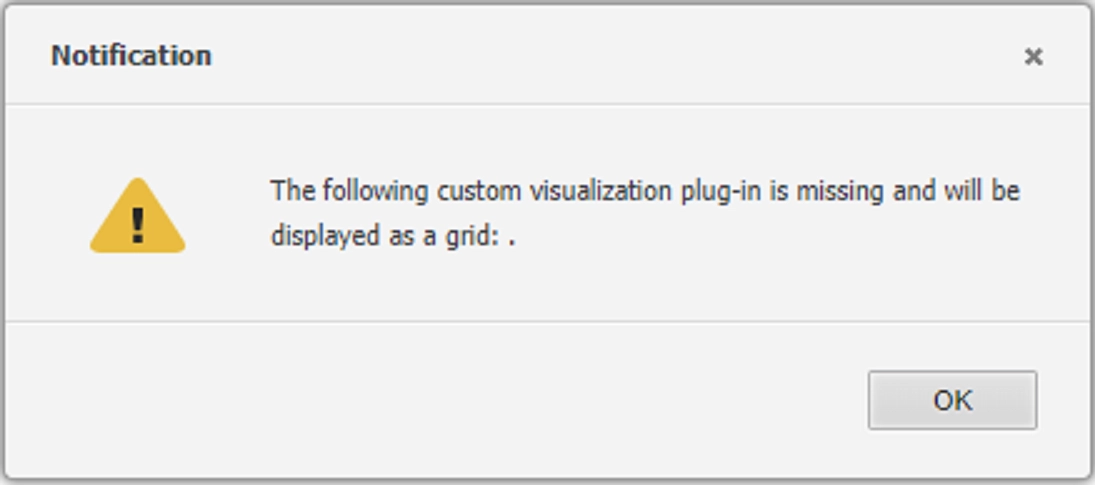
In this situation, the converted Visual Insight visualization is used in an information window in a multi-layout document. After switching layouts and manipulating the document, clicking on the information window throws the following error:
ka04W000000ObjvQAC_0EM44000000Q7tv.png


Notification
The following custom visualization plug-in is missing and will be displayed as a grid: .

STEPS TO REPRODUCE:
While there are a variety of ways to reproduce this error in Strategy Web 10.x, this is one example of how to do so.

  1. In the Strategy Tutorial project, create a Visual Insight dashboard with a bar graph
  2. Save the Visual Insight dashboard. 
  3. Convert the Visual Insight dashboard to a Report Services Document. Save this as "Document1"
  4. Create a new Blank Document. Save this as "Document2"
  5. Within Document2, go to Tools --> Import Document. Choose Document1, which will import Document1 as a new layout of Document2. The original layout is automatically named "Layout 1".
  6. On Layout 1, insert a new panel stack. Call this PanelStack1.
  7. Right click the panel stack and go to the "Properties and Formatting" menu.
  8. Choose "Use as Information Window" 
  9. On the Document2 layout, copy the bar graph and paste it in PanelStack1. 
  10. On Layout 1, create a new text box.
  11. In the text box, enable PanelStack1 as the information window.


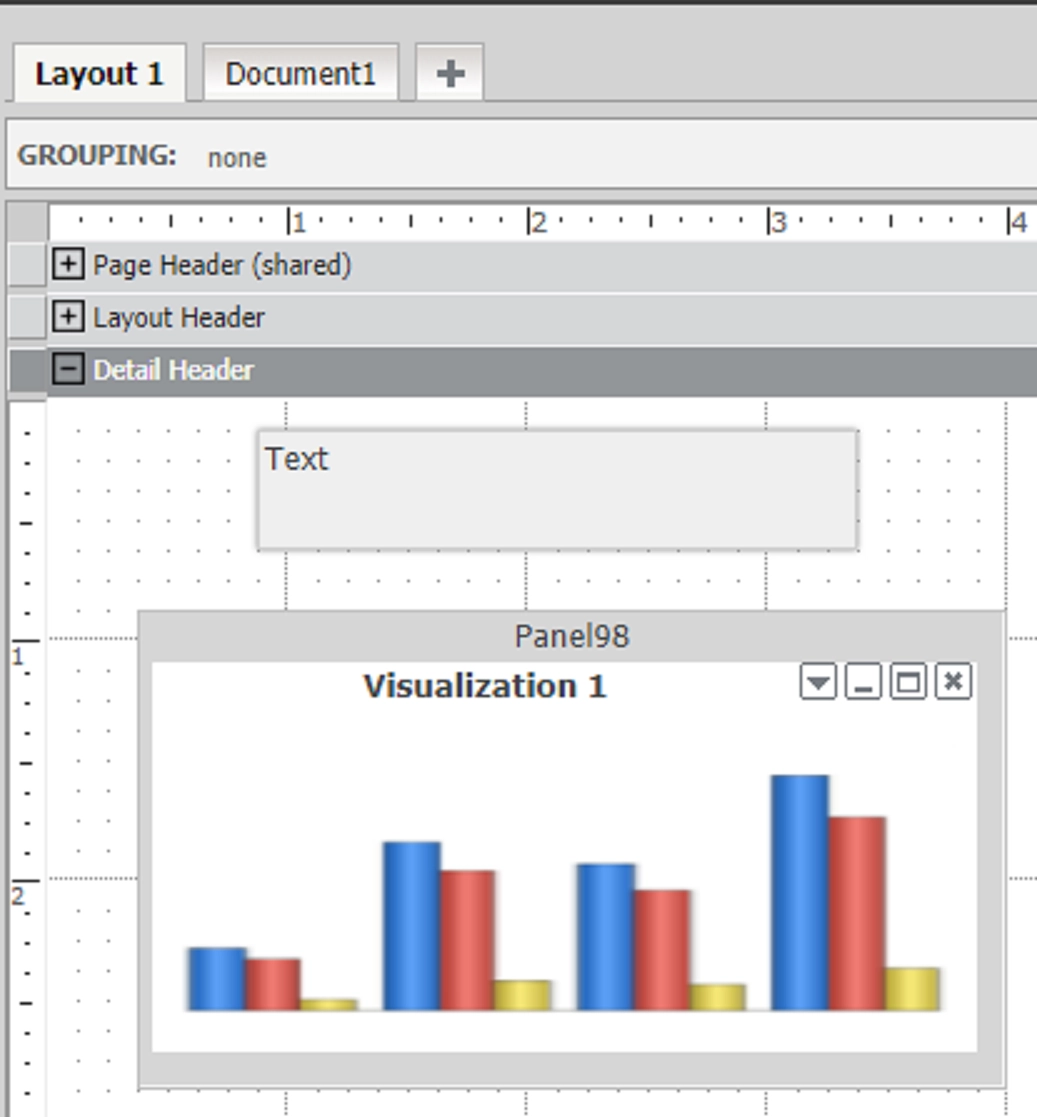
The document should now look similar to the following screenshot:
ka04W000000ObjvQAC_0EM44000000Q7uA.png
  1. Run Document2 to Presentation Mode. 
  2. Click on the text box. Note that the information window comes up successfully. 
  3. Navigate to the second layout, containing the imported Document1.
  4. Navigate back to the Layout 1 and trigger the information window. Note that the error comes up.

CAUSE:
This has been identified as a defect in Strategy Web 10.x. The error shows for both custom and out of the box visualizations created in Visual Insight. If the visualization is a grid, the error does not show after modifying the steps to reproduce.
ACTION:
This is currently under review by Strategy to determine a root cause and potential fix in a future version of Strategy Web. Contact Strategy Technical Support for an update on this investigation. 
WORKAROUND:
Create the visualization directly in the Strategy Web 10.x Report Services Document.
The Strategy Internal Reference Number for this issue is DE80651. 38958 KB438958


Comment

0 comments

Details

Knowledge Article

Published:

November 21, 2017

Last Updated:

December 28, 2018